If you’re trying to track your SEO performance in GA4 but the reports you need aren’t available, know that GA4 lets you create your own.
This article will show you how to create five essential SEO reports that go beyond just measuring traffic. You’ll learn how to assess engagement, track important actions (or key events as GA4 calls them), understand how device types influence user behavior, compare different visitor groups, and identify where people are leaving your site.
What is SEO and why is it important?
Before we start building the reports, we should understand what we’re measuring. Search Engine Optimization is about attracting organic search traffic – people who find your website on Google (or other search engines) without you having to pay for an ad. Since these users are searching for what you offer, they are some of your most valuable visitors.
Finding out which pages actually lead to conversions (key events), which devices need improvement, and where people leave the website will give you a real understanding of where to invest your time and money. And that’s what these SEO reports will help you achieve.
Setting up your SEO report collection
Before we build individual reports, let’s create a dedicated space for them. Here’s how to set up an SEO report collection in GA4:
- Go to Reports and click Library at the bottom left.
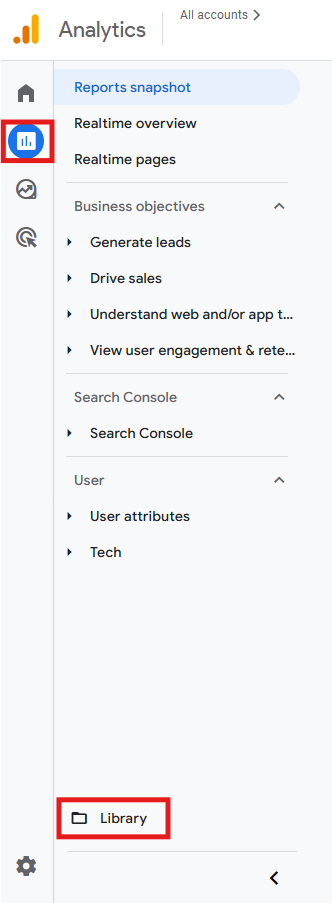
- Choose an existing collection where you want to add your SEO reports or create a new one. We’ll use the “Life cycle” collection as an example in this article.
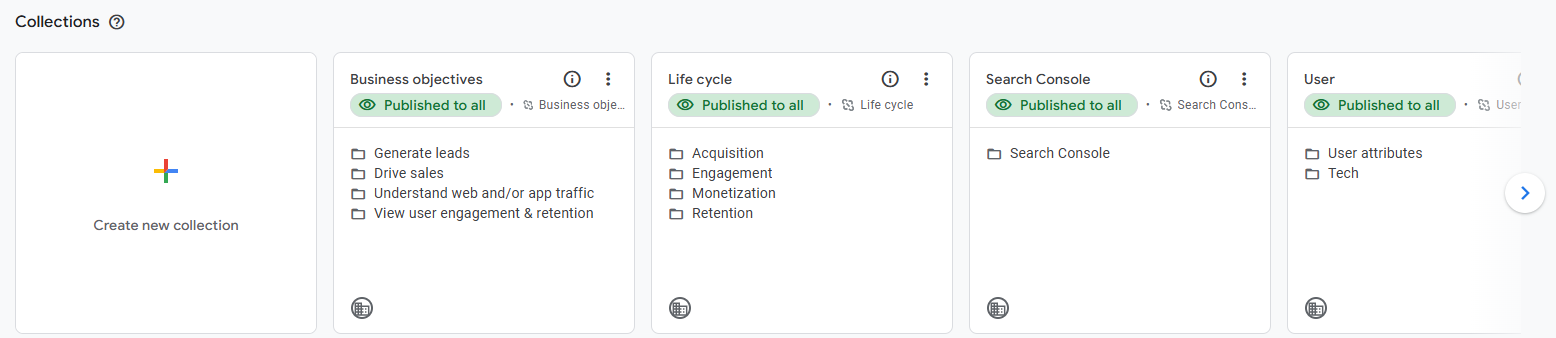
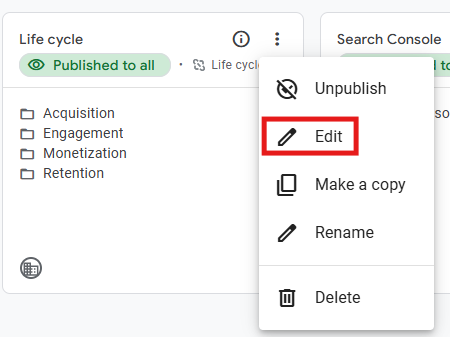
- Click Edit.
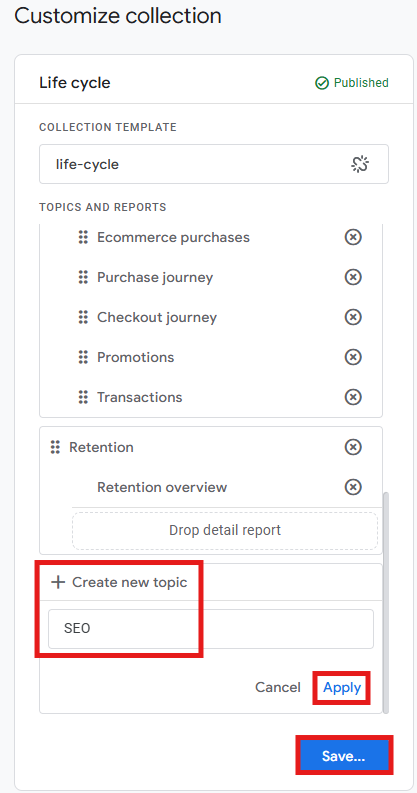
- Create a new topic called “SEO” (each collection supports up to five topics). Click Apply, then save changes to current collection.
Now, let’s create the actual SEO reports.
Report #1: Engagement rate by organic landing pages
The engagement rate is the percentage of sessions in which users interact with your content. For SEO, this metric is important because it indicates to Google that your content is relevant and valuable. Pages with low engagement rates might rank well initially, but they remain vulnerable. If visitors regularly bounce back to search results, Google notices. High engagement rates, on the other hand, signal quality content and can help sustain or improve rankings.
How to build this report in GA4:
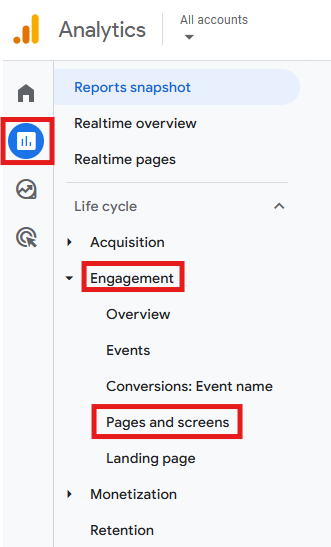
- Navigate to Reports > Engagement > Pages and screens.
- Click the pencil icon in the top right to customize the report.

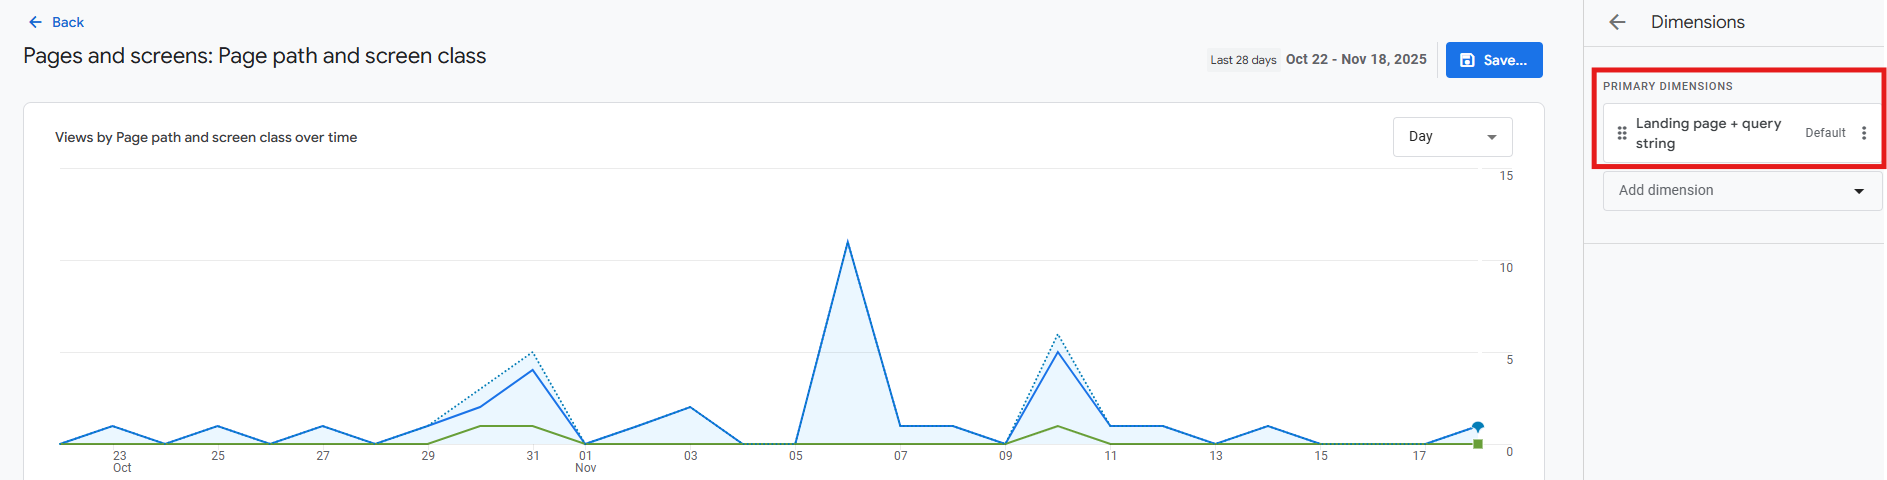
- Under Dimensions, add Landing page + query string and remove other dimensions. Click Apply.
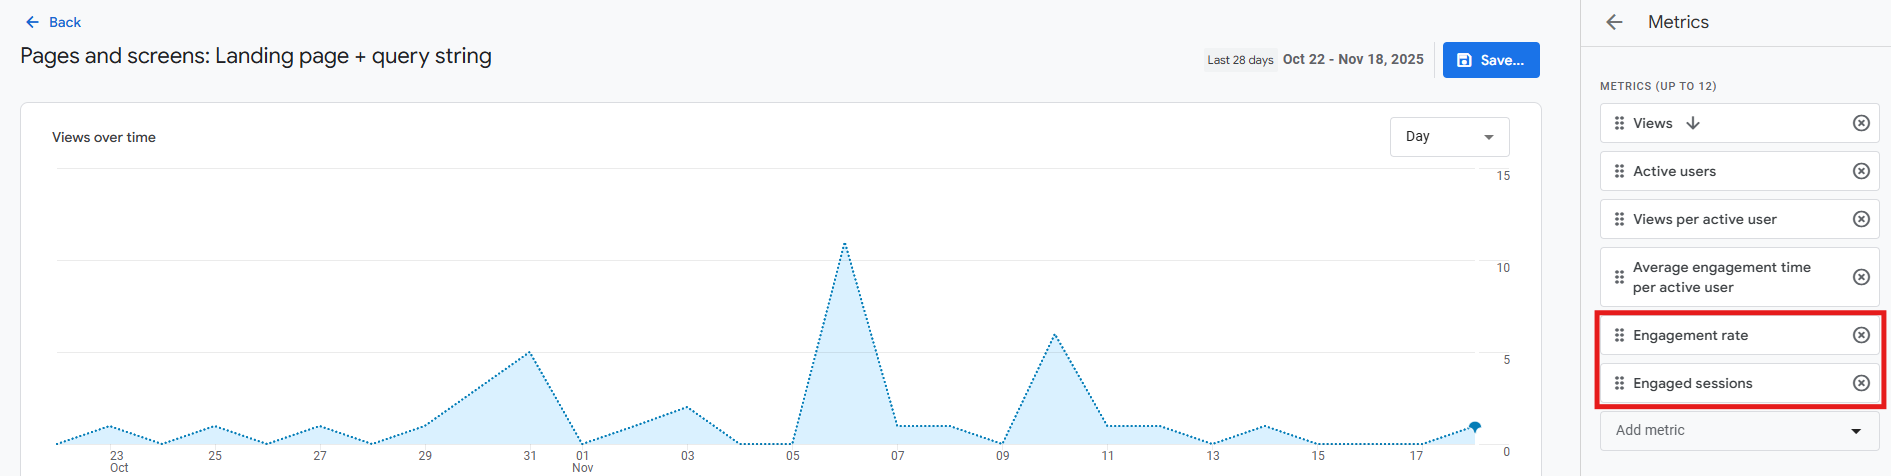
- Under Metrics, add Engagement rate and Engaged sessions to your metrics list. Keep views and user-related metrics for context as well. Click Apply.
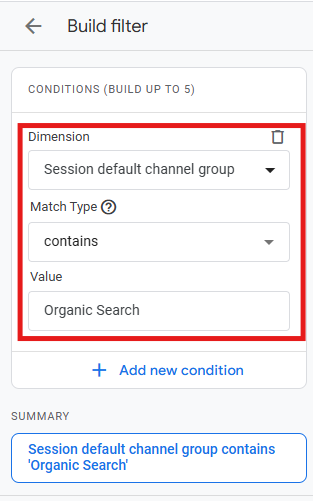
- Add a filter: Session default channel group contains Organic Search. Click Apply.
- Click Save as a new report and name it “Engagement rate – organic landing pages”.

- Go back to Reports > Library > edit the collection you previously chose or created, find this report, and drag it into your SEO topic. Save changes to current collection.
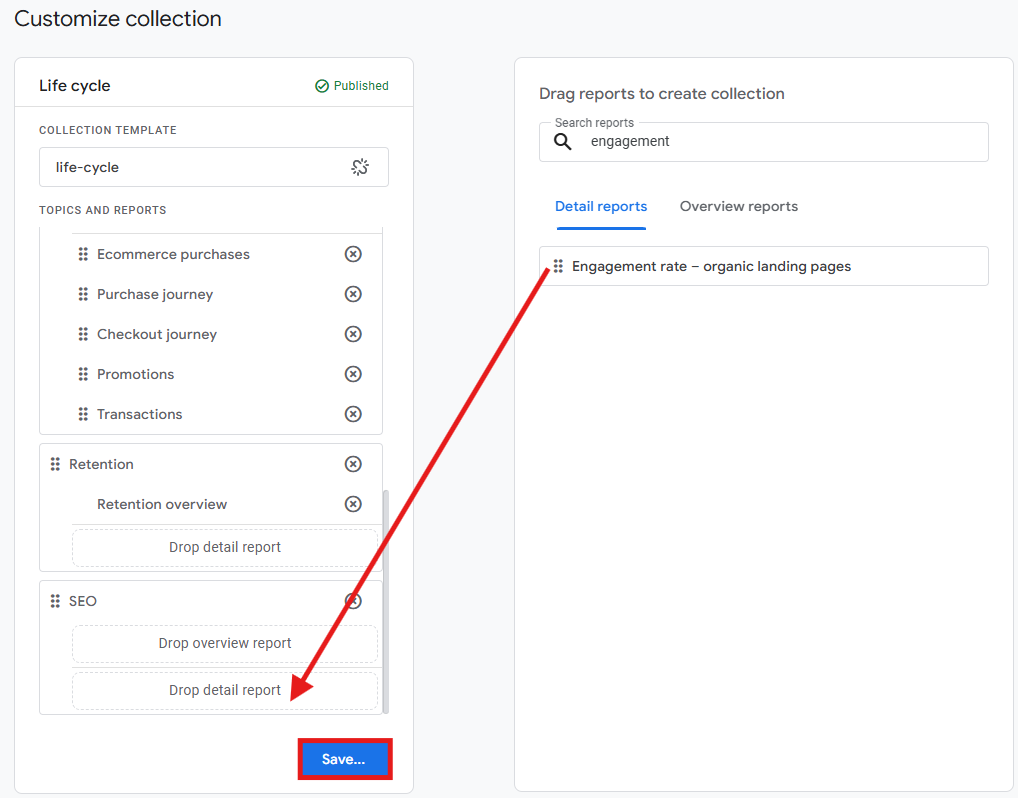
Now you can see which organic landing pages keep visitors engaged and which ones send them back to Google.
Tip: compare your engagement rates to your website’s average. Pages significantly below average need attention (better content, improved formatting, or faster load times). For pages with high engagement rates, identify what makes them work and replicate those elements elsewhere.
Report #2: Organic traffic key event rate by landing page
Traffic without key events is merely numbers. This report shows which organic pages genuinely contribute to business results, whether that’s form submissions, purchases, or other critical actions.
This is important to look at because a page that ranks well but never converts might not be worth further optimization. Meanwhile, pages with high conversion rates deserve more SEO investment to attract even more qualified traffic.
How to build this report in GA4:
- Go to Reports > Engagement > Pages and screens.
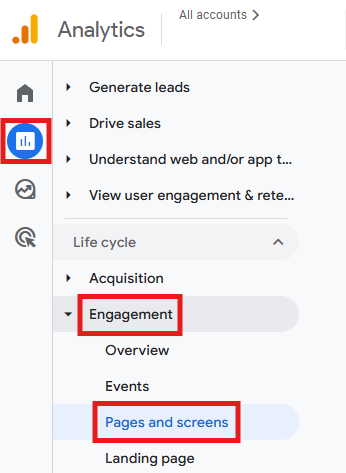
- Click the pencil icon to customize it.

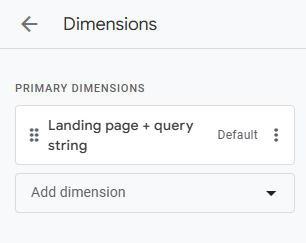
- Under Dimensions, set Landing page + query string as your primary dimension. Click Apply.
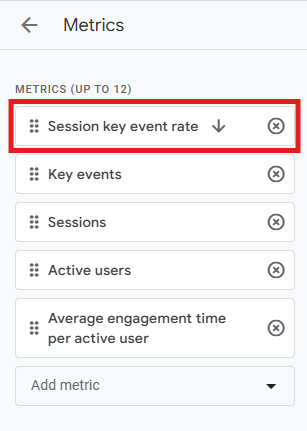
- Under Metrics, add Session key event rate as your first metric. Also, add Key events, Sessions, and user-related metrics for full context.
- Add a filter: Session default channel group contains Organic Search. Click Apply.
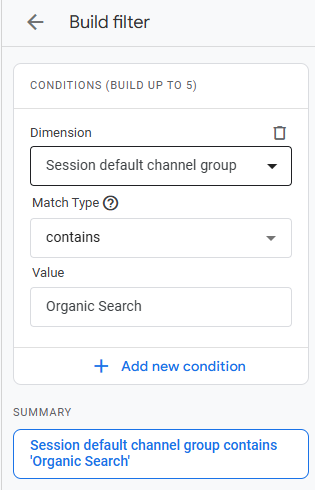
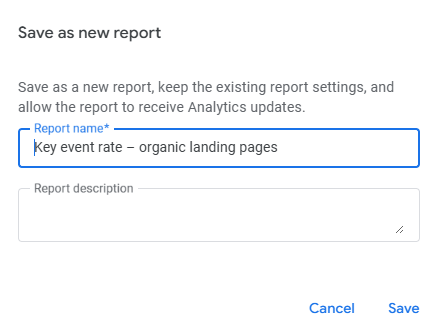
- Save as a new report named “Key event rate – organic landing pages”.
- Return to Reports > Library > edit the collection, find this report, and drag it into your SEO topic. Save changes to current collection.
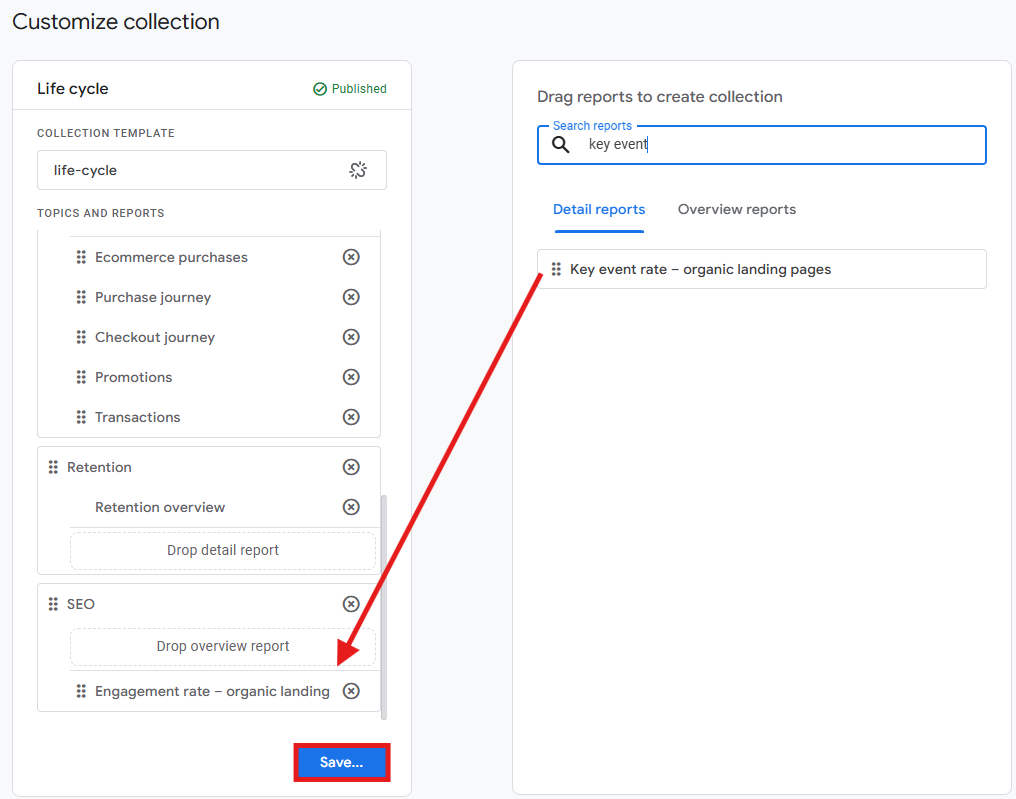
This report reveals your most valuable organic pages from a business perspective, not just a traffic perspective.
Tip: identify your key event top-performing pages, since these are the ones that deserve priority in your SEO strategy. For pages with high traffic but low conversions, dig into why.
Report #3: Mobile vs. desktop organic performance
Your organic visitors use different devices, and their behavior varies significantly between mobile and desktop. Understanding these differences helps you prioritize optimization efforts where they’ll have the biggest impact.
For instance, if most of your organic traffic comes from mobile but your mobile experience needs improvement, you’re losing potential conversions. Google’s mobile-first indexing also means your mobile experience directly impacts rankings across all devices.
How to build this report in GA4:
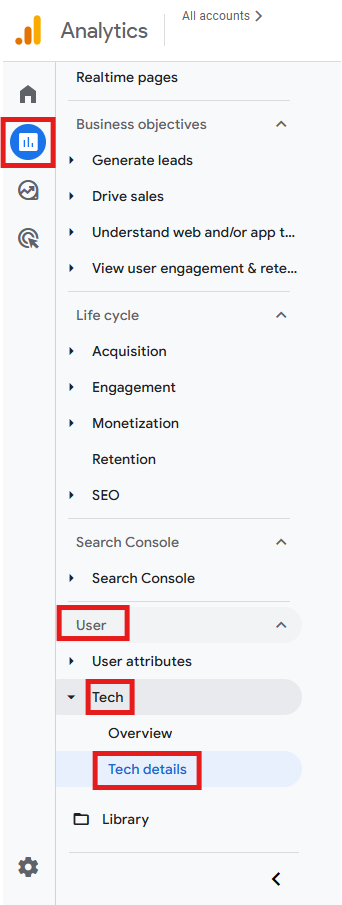
- Go to Reports > User > Tech > Tech details.
- Click the pencil icon to customize it.

- Under Dimensions, set Device category as your primary dimension. Click Apply.
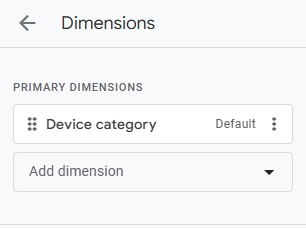
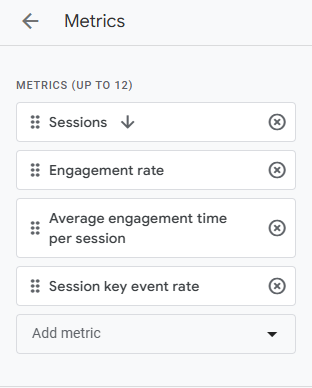
- Under Metrics, add Sessions, Engagement rate, Average engagement time per session, and Session key event rate. Click Apply.
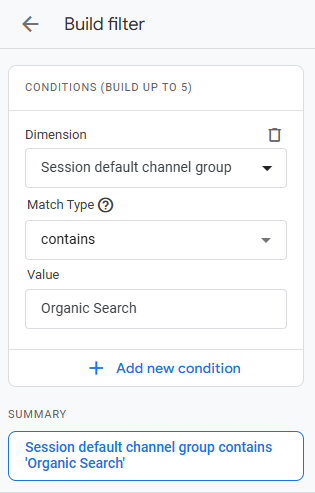
- Add a filter: Session default channel group contains Organic Search. Click Apply.
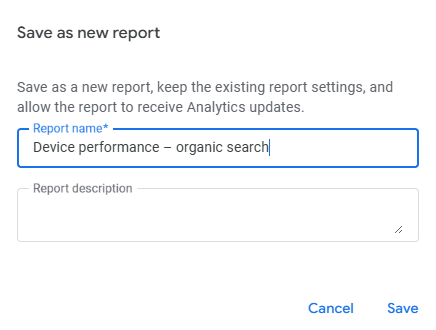
- Save as a new report called “Device performance – organic search”.
- Go to Reports > Library > edit the collection, find this report, and drag it into your SEO topic. Save changes to current collection.
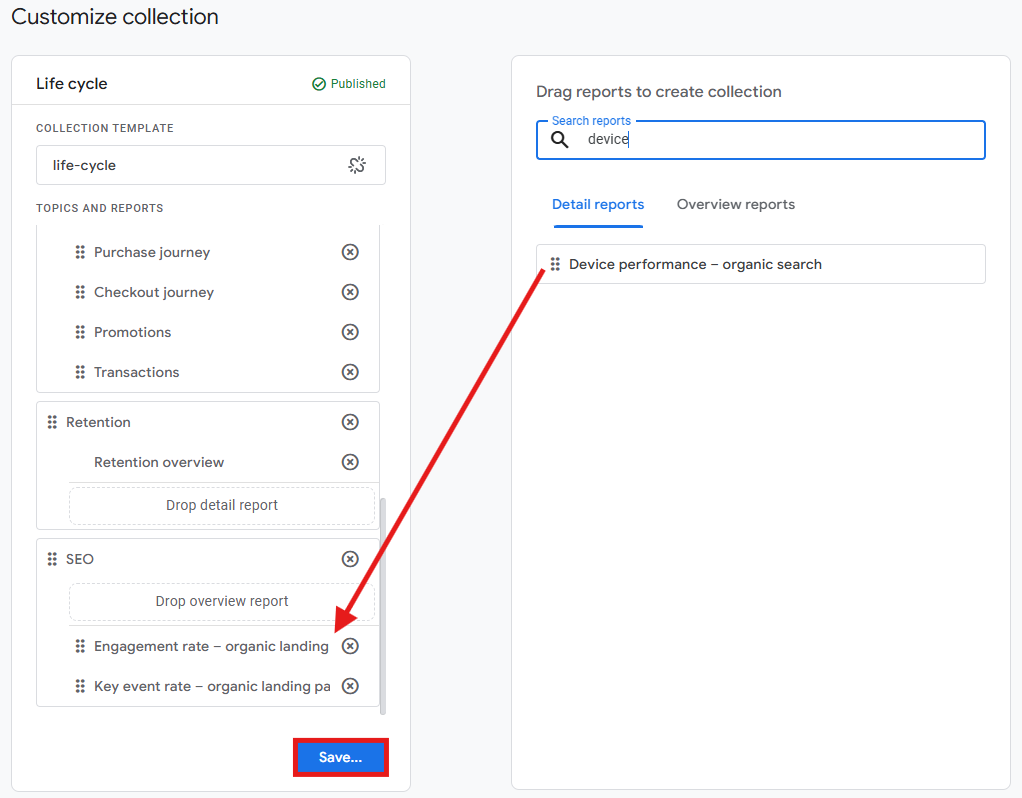
You’ll now see side-by-side performance data for mobile, desktop, and tablet organic visitors.
Tip: compare engagement rates and key event rates across devices. If mobile engagement is significantly lower than desktop, your mobile experience needs work. Check average engagement time too, since shorter mobile sessions might indicate readability issues or slow load times.
Report #4: Segment overlap for organic visitors
This report illustrates how various audience segments overlap, helping you understand your most valuable organic visitor profile. You can then develop content specifically aimed at attracting more people who match that profile.
How to build this report in GA4:
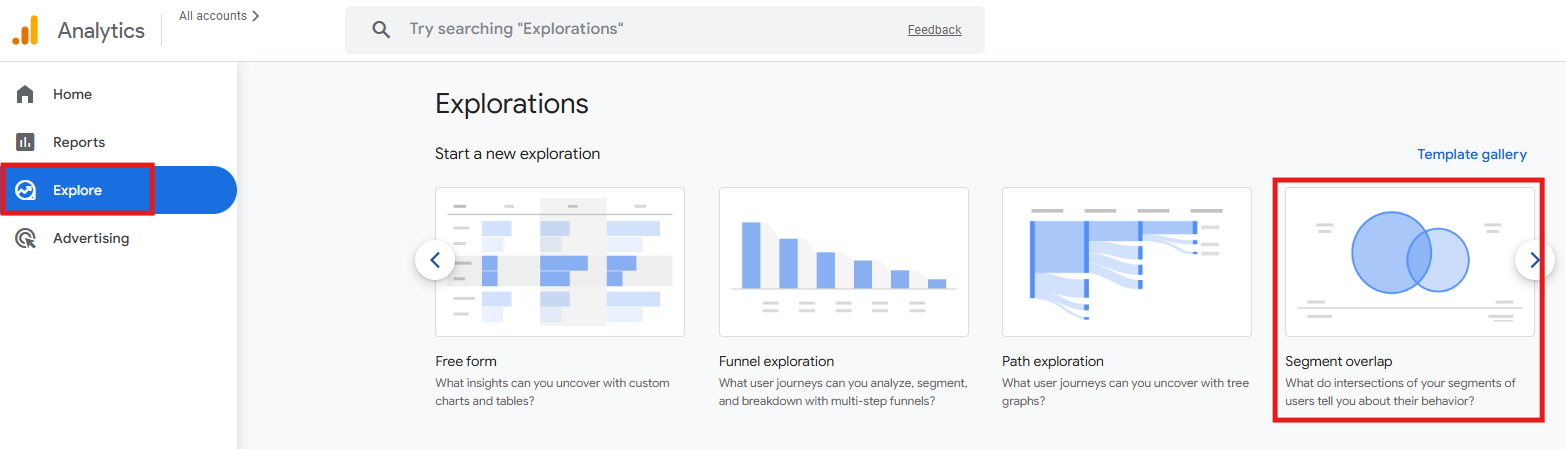
- Go to Explore, scroll to the right, and select Segment overlap.
- Under Segments, click + to create your first segment (you can delete other segments that exist there by default).
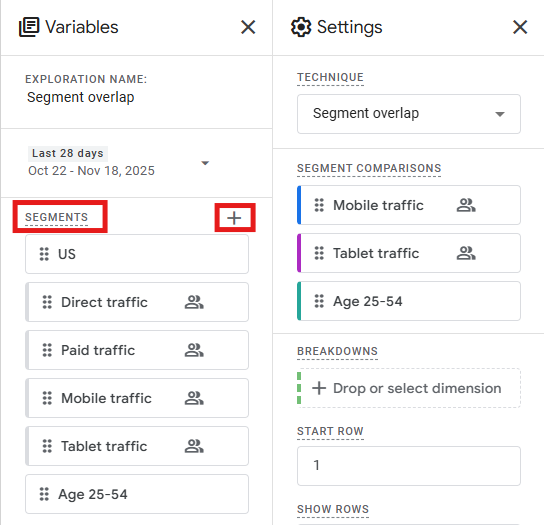
- To create a segment called Organic visitors, click Create a new segment.

- Select Session segment.

- Add new condition: Session default channel group contains Organic Search. At the top, make sure the segment is properly named and then Save to property.
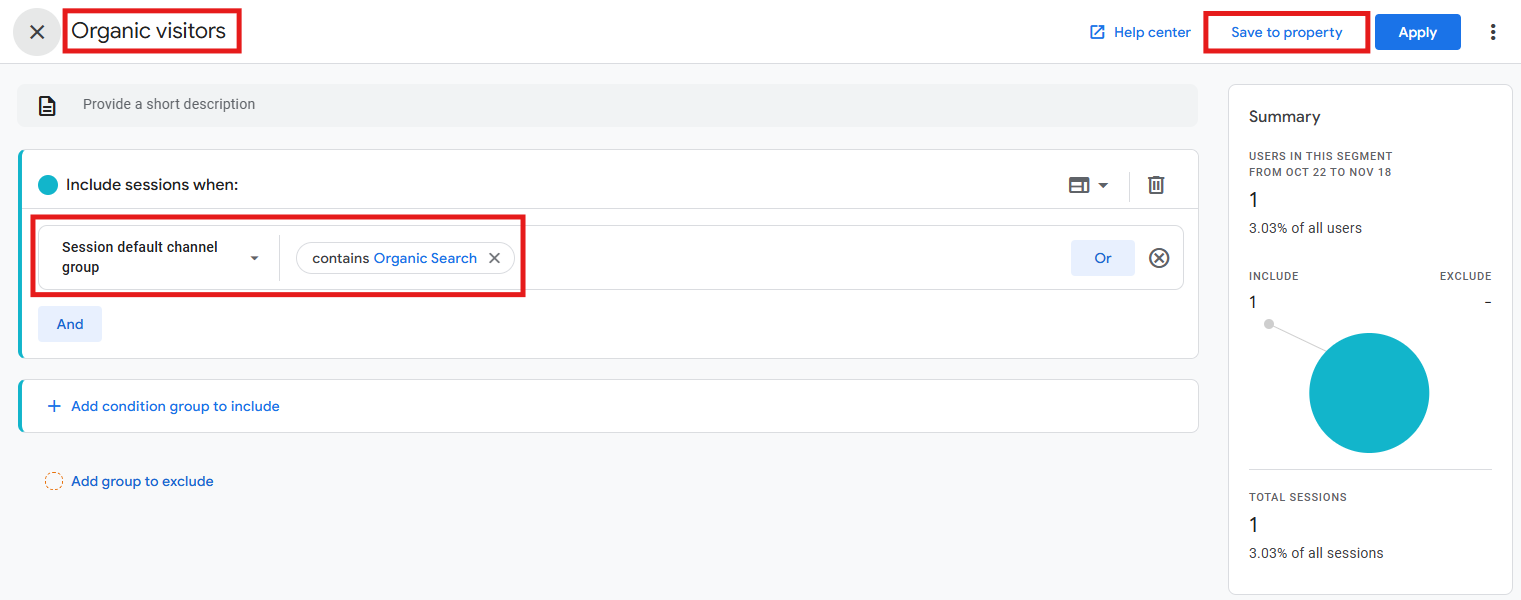
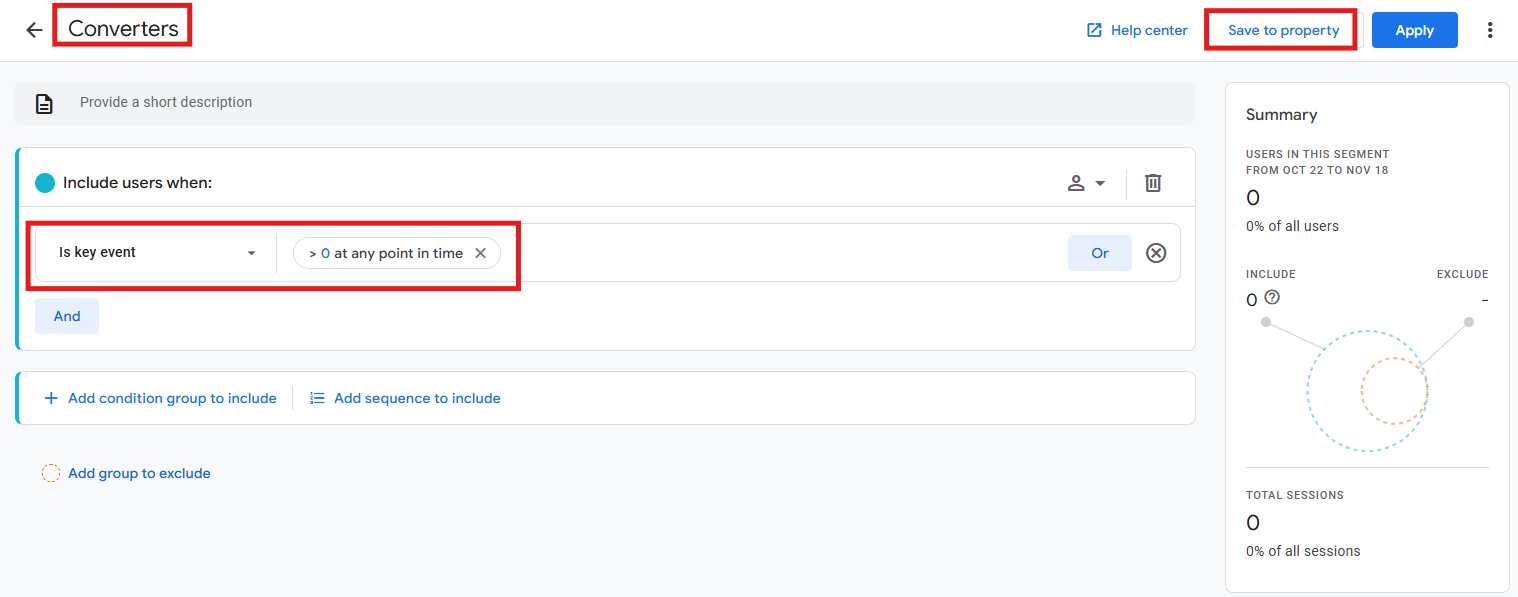
- Create a second segment called Converters and select User segment.

- Set condition: Key event greater than 0. At the top, make sure the segment is properly named and then Save to property.
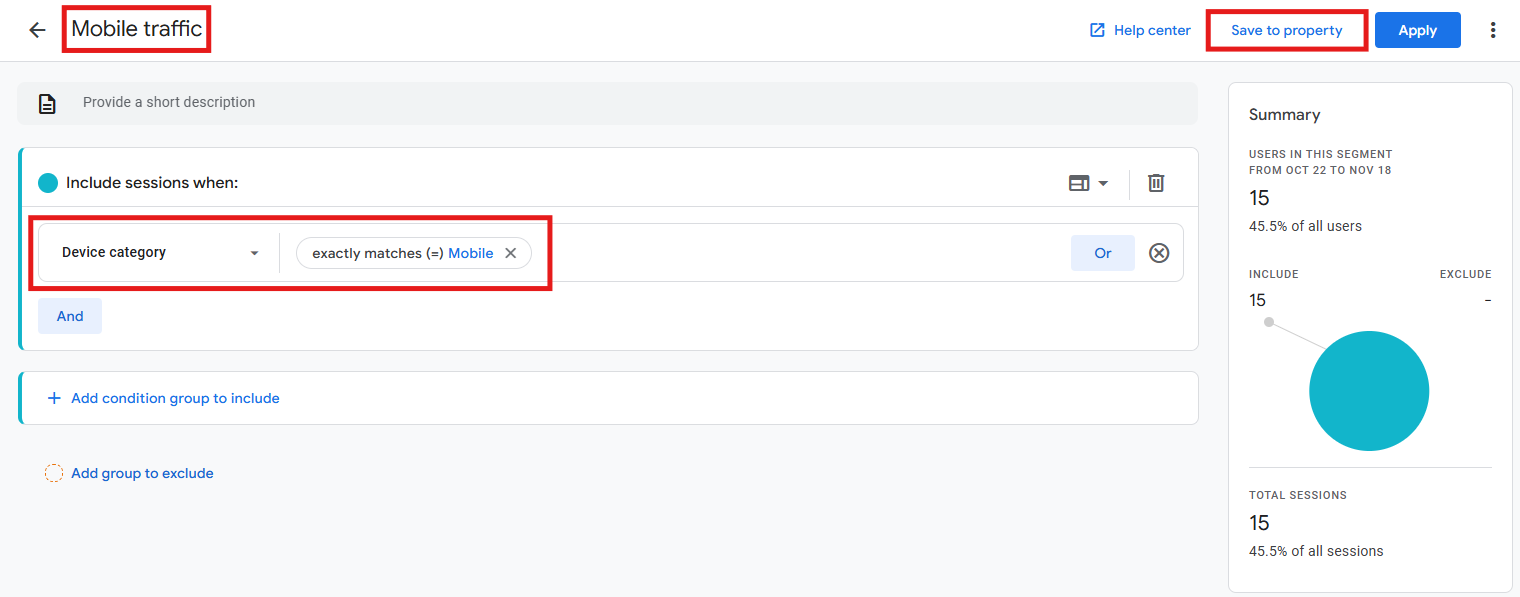
- Create a third segment for device type, such as Mobile traffic (you can replicate this for any type of device). Select Session segment.

- Set condition: Device category exactly matches mobile. At the top, make sure the segment is properly named and then Save to property.
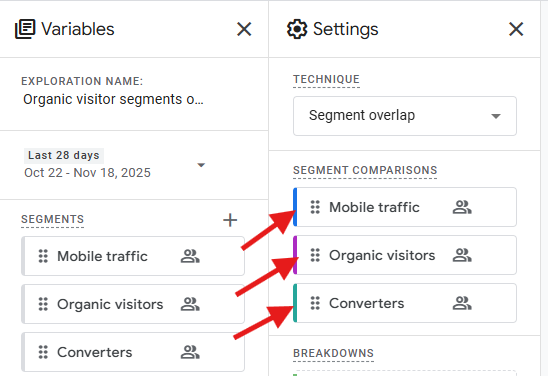
- Under Segment Comparisons, drag all the segments you just created.
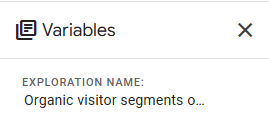
- In the end, under Exploration Name, make sure you write something clear like “Organic visitor segments overlap”, so you can revisit it at any time.
The diagram now shows you how the segments you created overlap, revealing your most valuable audience combinations.
Tip: the center of the diagram (where all segments overlap) represents your highest-value segment. See how large this overlap is compared to other combinations to find SEO optimization opportunities. You can also swap out segments to test different hypotheses. Try comparing new vs. returning organic visitors, or organic visitors from different geographic regions.
Keep in mind: unlike previous reports, this exploration is in the Explore section and cannot be added to your SEO reports collection. Consider bookmarking it or creating a dedicated folder for your most-used explorations.
Report #5: Exit pages for organic traffic
Exit pages show you where organic visitors leave your website. While some exits are natural (like after completing a purchase), unexpected exit patterns can reveal content gaps, broken user journeys, or pages that don’t effectively guide visitors to the next step. Recognizing these exit patterns helps you address user experience issues and retain visitors longer.
How to build this report in GA4:
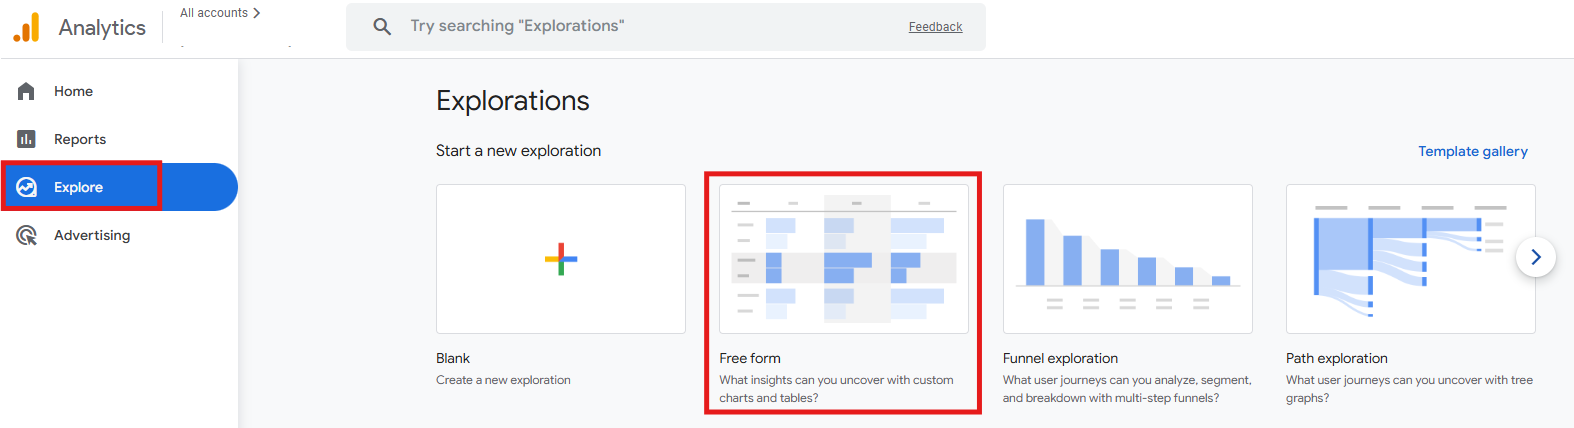
- Go to Explore and select Free form.
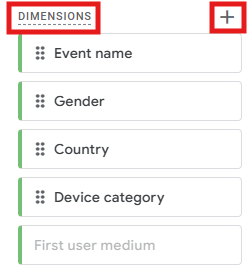
- Under Dimensions, click + (you can delete other dimensions that exist there by default).
- Search for Page path and screen class. Add this dimension to your exploration by clicking Confirm.

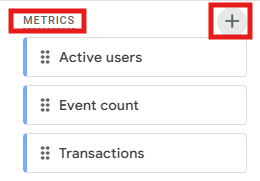
- Click + next to Metrics (you can delete other metrics that exist there by default).
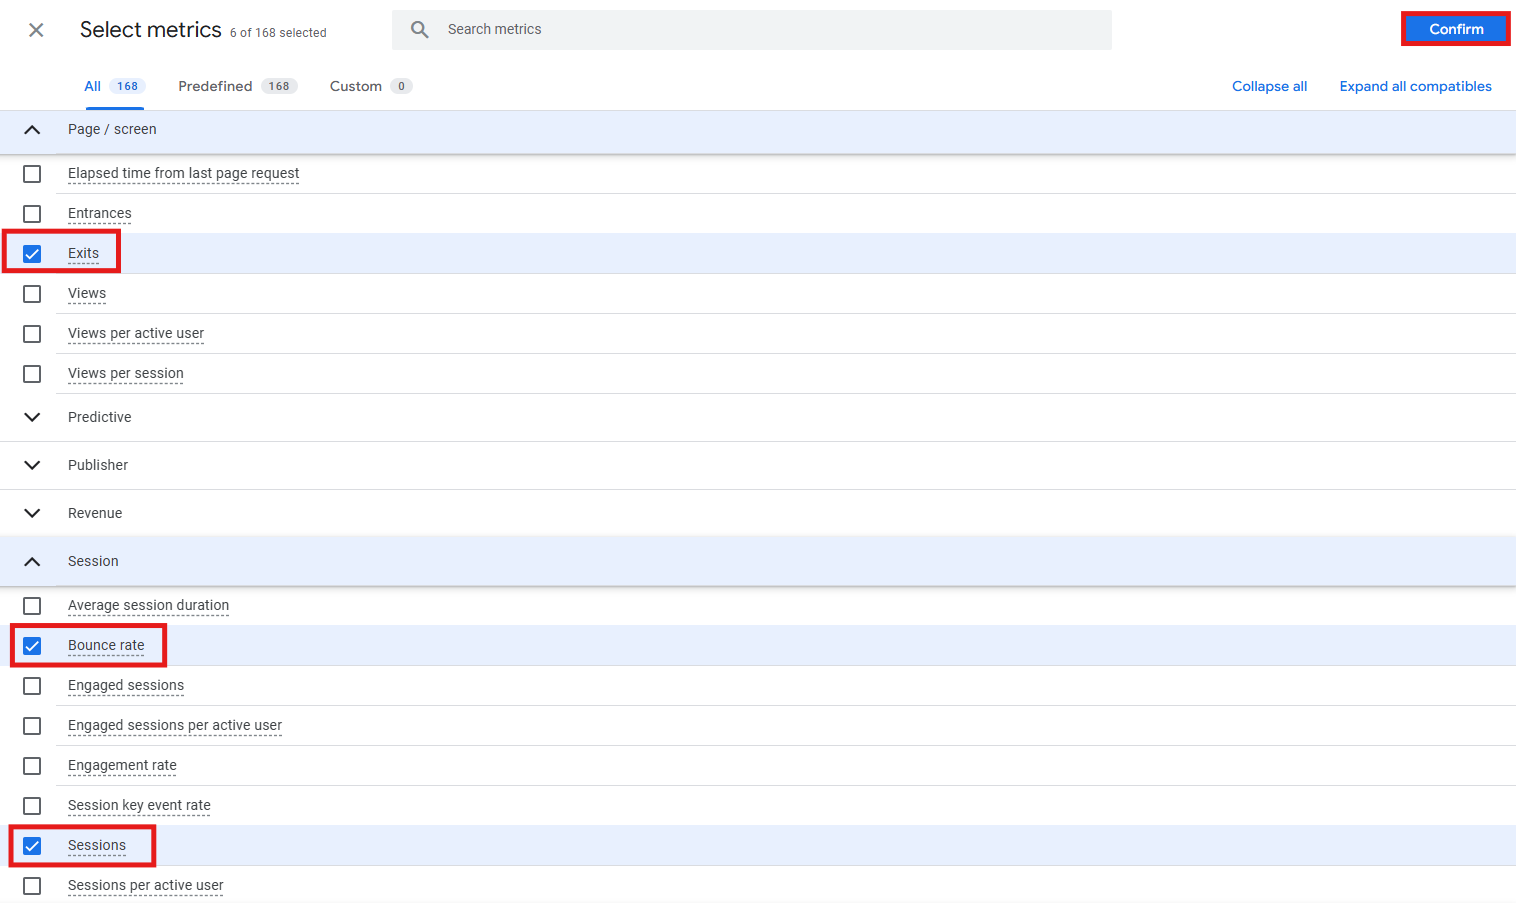
- Add Exits and Bounce rate. You can also add Sessions for context. Click Confirm.
- Under Segments, click + to create a new segment (you can delete other segments that exist there by default).
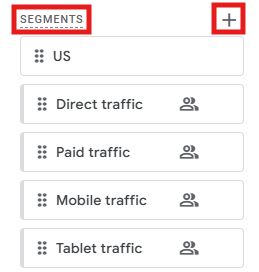
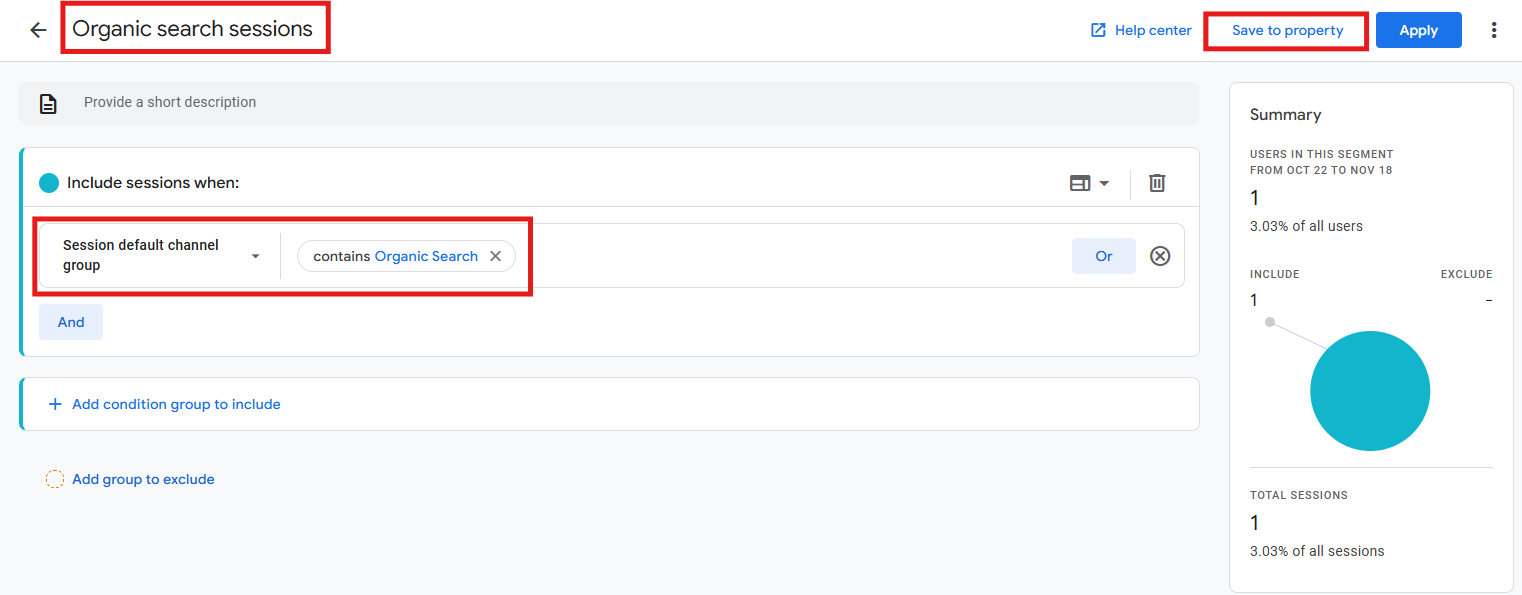
- Select Session segment.

- Set condition: Session default channel group contains Organic Search. Name it Organic search sessions and Save to property.
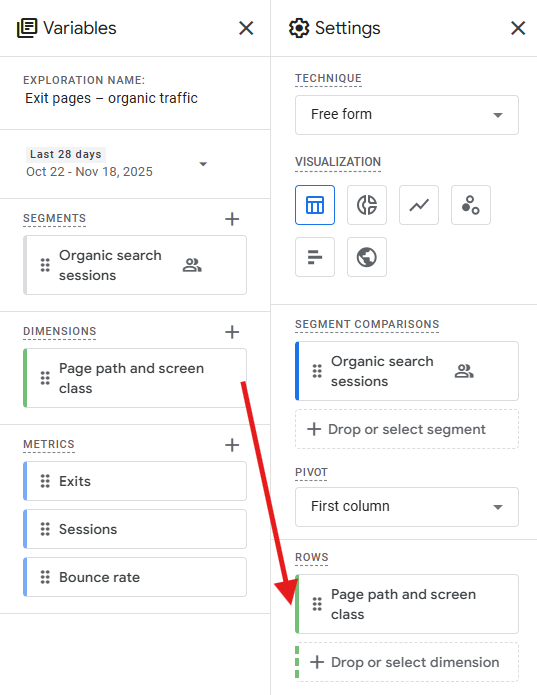
- Drag Page path and screen class to the Rows section.
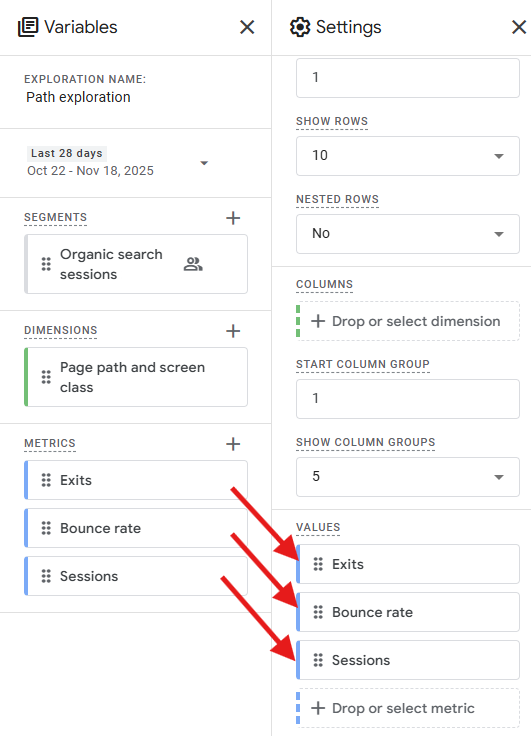
- Drag Exits, Bounce rate, and Sessions to the Values section.
- Name your exploration Exit pages – organic traffic.
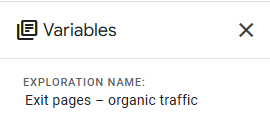
This report now shows you which pages organic visitors most often leave from, along with the bounce rate (percentage of unengaged sessions on each page). When analyzing this, bear in mind that context matters: high bounce rates on blog posts might be normal if people find their answer and leave satisfied, but high bounce rates on product pages or mid-funnel content indicate potential issues.
Tip: look for patterns in your high-exit pages. Are they all missing calls to action? Do they load slowly? Are they dead ends with no internal links to related content?
Keep in mind: like the segment overlap report, this exploration can’t be added to your main reports collection but should be checked regularly as part of your SEO analysis routine.
What you can do with these reports
Building reports like these is only the first step. With regular check-ins, here’s how to use them to your advantage:
-
Start with key event rates
Identify your top-performing organic pages from report #2. These are your proven “stars”.
-
Check engagement
Look at those same pages in report #1. Do you see high conversions with high engagement rates? Then you’ve found your template for success. If you notice pages with high conversions but lower engagement, there could be an opportunity to improve.
-
Analyze by device
Use report #3 to check if your top pages perform consistently across devices. If desktop converts well but mobile doesn’t, you’ll know where to focus your optimization efforts.
-
Understand your audience
Report #4 shows you which segments overlap the most. If mobile organic converters are significant, focus on mobile SEO. If they are minimal, figure out why.
-
Find the leaks
Report #5 reveals where you’re losing organic visitors. If people leave from pages that should lead to conversions, improve the user journey on those pages.
-
Enhance analysis using advanced metrics and filters
You can deepen your analysis by adding secondary dimensions like country or device category, comparing date ranges for trend analysis, setting up custom alerts for traffic changes, filtering by page type to identify top-performing content, or tracking specific key events to see which pages influence particular business outcomes.
What’s next for your SEO reporting?
The beauty of GA4’s customization is that you can build reports that answer nearly any question about your organic search performance. These five reports provide a solid foundation, but they are just the start. As you become more comfortable, you can expand your reporting to include additional perspectives, such as:
- Geographic performance: which countries or regions drive your best organic traffic?
- Content categories: how do different topics or product categories perform?
- Seasonal patterns: do certain pages or keywords follow predictable seasonal trends?
- Search Console integration: if you combine GA4 data with Search Console metrics, you can identify which keywords are driving traffic to your website and see how it ranks for specific search queries. Review the basics of the GA4-Search Console link in our article GA4 – Google Search Console integration guide.
Ready to go even further?