Have you recently changed something in Google Tag Manager and published it right away? You better hope it’s working, because you won’t know for sure until you check your reports and by then you might have days of bad data.
The easy way to avoid this? Use GTM’s Preview mode and see exactly what’s happening before you publish. Does that tag fire? Does it send the right data? Why didn’t that trigger work? Here’s how to use Preview mode to get those answers immediately.
What Preview mode does and why you need it
Preview mode is Google Tag Manager’s testing environment. When you use it, you’re essentially creating a private debugging session where only you can see what’s happening backstage. There’s really no down side to using it:
- See which tags fire on each page interaction in real time.
- Understand exactly why tags fired or didn’t fire.
- Check all variable values at the moment of each event.
- Access complete data layer contents for every interaction.
- Get error messages when tags fail.
Without Preview mode, your only option is to publish changes blindly and hope they work – which is never a good idea when your business is at stake.
Using Preview mode
It’ll take you about 30 seconds to get Preview mode up and running. Start from your GTM container:
-
Click the Preview button (top right corner, next to Submit).

-
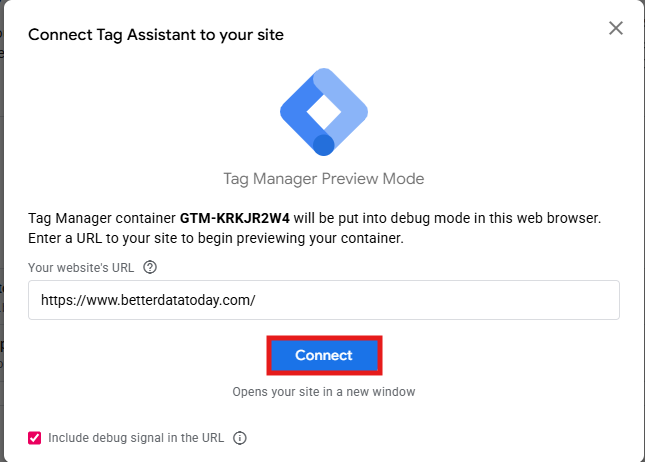
A new tab opens showing Tag Assistant. Enter your website URL in the connection dialog and click Connect.
-
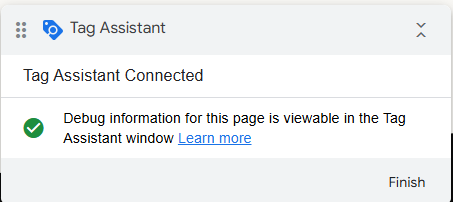
Your website opens in a new window with a small badge in the bottom-right corner showing “Tag Assistant Connected”. That badge confirms Preview mode is active.
-
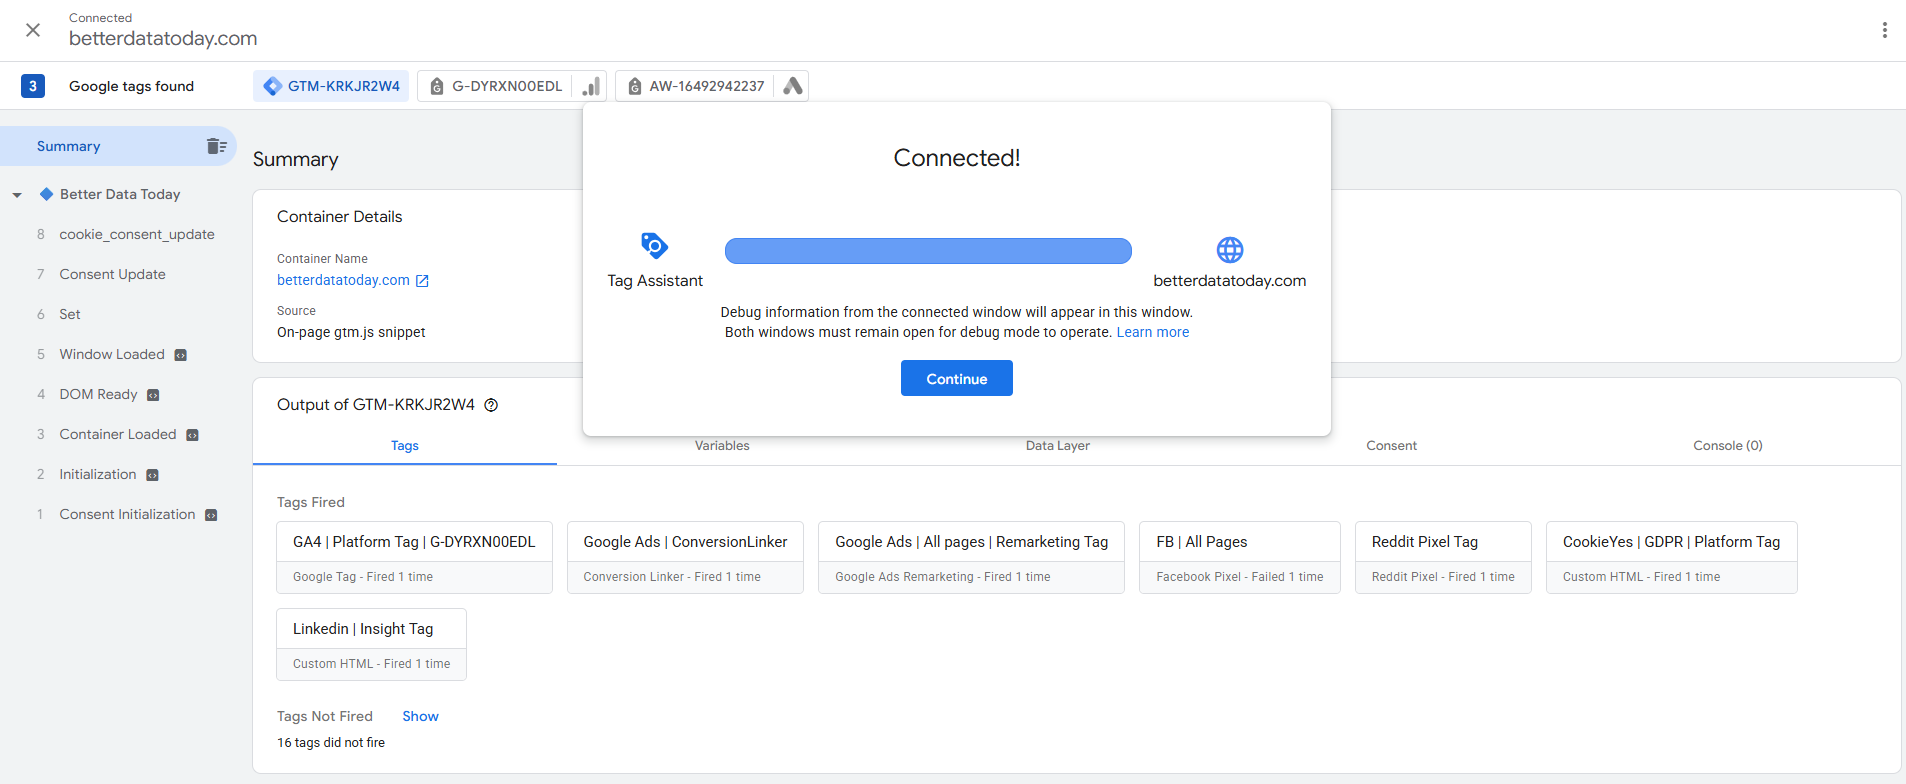
The Tag Assistant tab displays your debugging console where all the action happens.
Quick note: some websites add a debug parameter to your URL that can break certain pages. If your website doesn’t load correctly, disable the “Include debug signal in the URL” checkbox, in the connection dialog (step 2) and reconnect.
Understanding the Preview interface
The Preview interface has two main areas at your disposal: the event timeline (on the left) and the details panel (on the right).
A) Event timeline
Every interaction on your page creates an event in this timeline. You’ll always see these five events when a page loads:
- Consent Initialization: fires first, before anything else loads.
- Initialization: loads your main configuration tags.
- Container Loaded: your pageview tags fire here.
- DOM Ready: HTML is rendered and visible.
- Window Loaded: everything including JavaScript has finished loading.
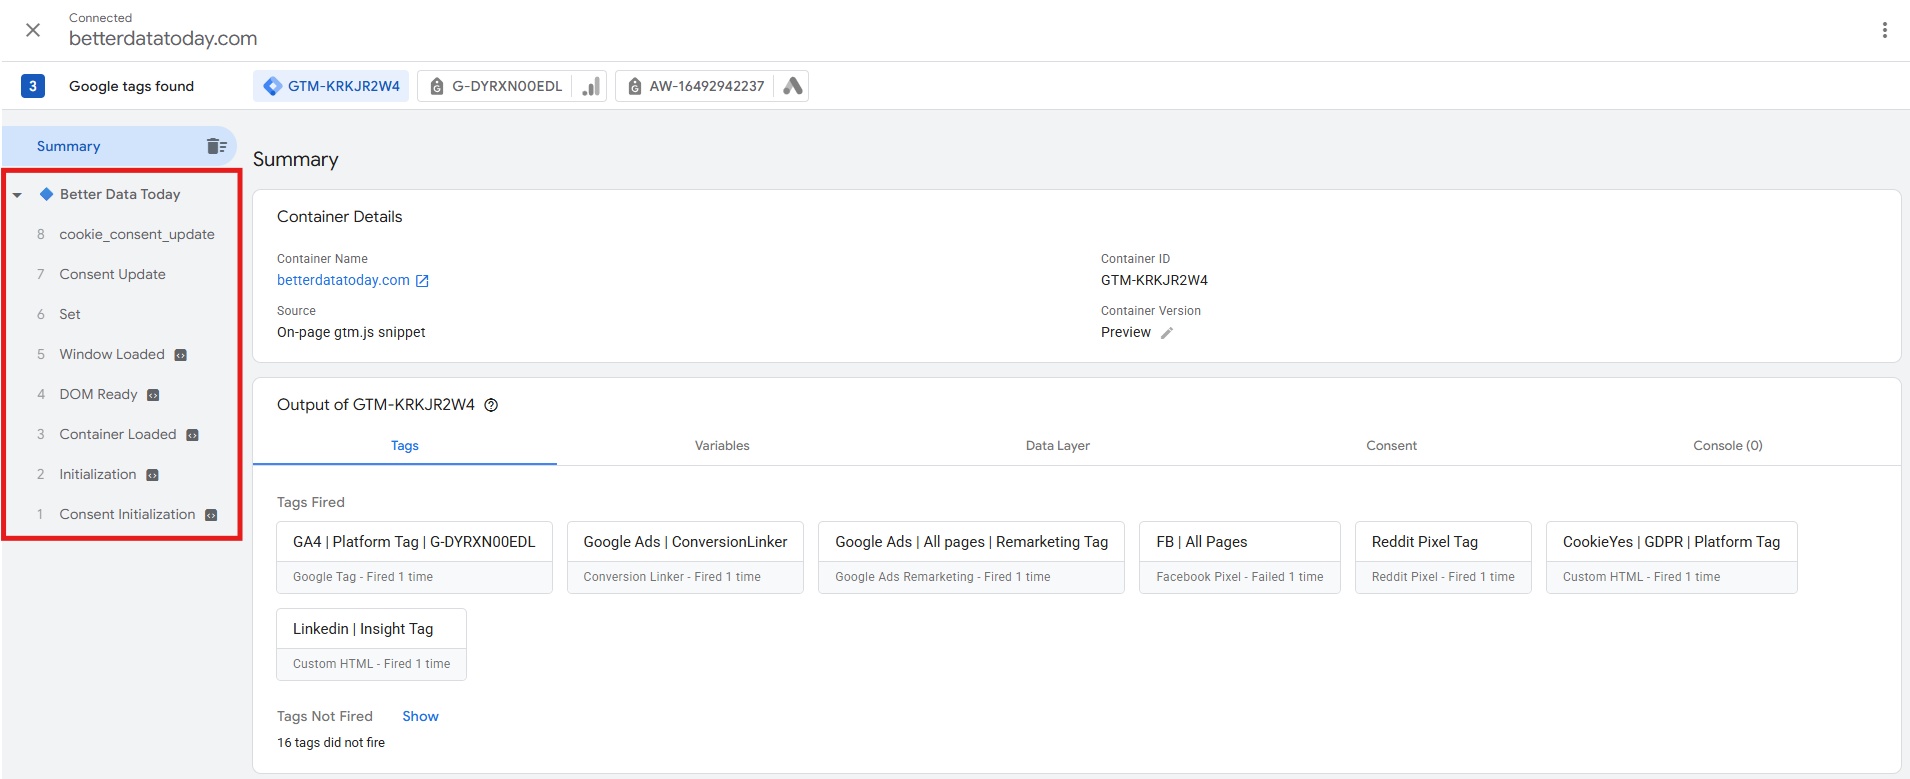
Custom events appear here too. You can click any event to inspect which tags fired, what variables contained, and what the data layer looked like.
B) Details panel
This panel changes based on which event you select. Here’s what each tab shows you:
-
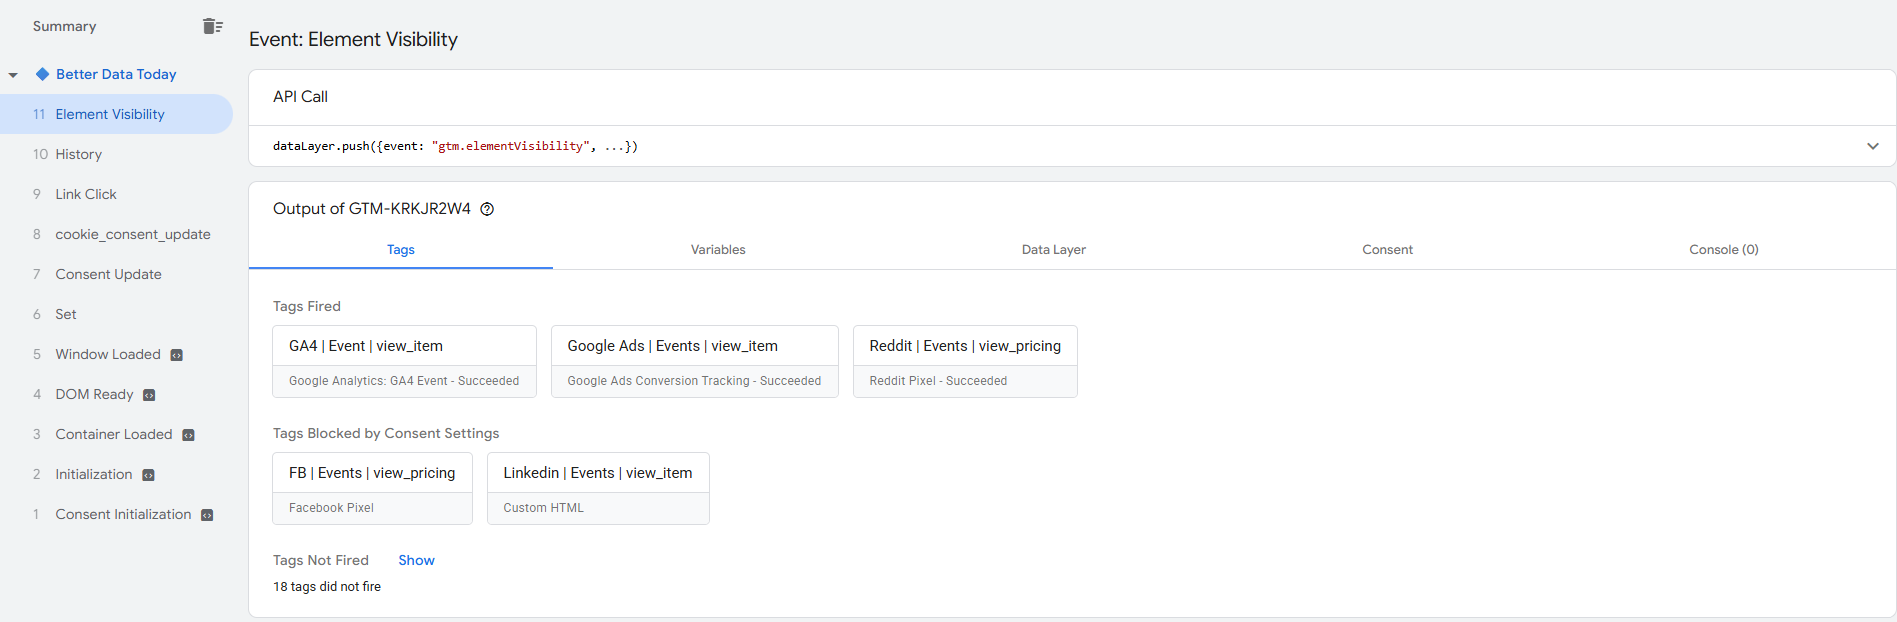
Tags tab shows which tags fired and which didn’t. Click any tag to see its configuration, what triggered it, and whether any blocking conditions prevented it from firing.
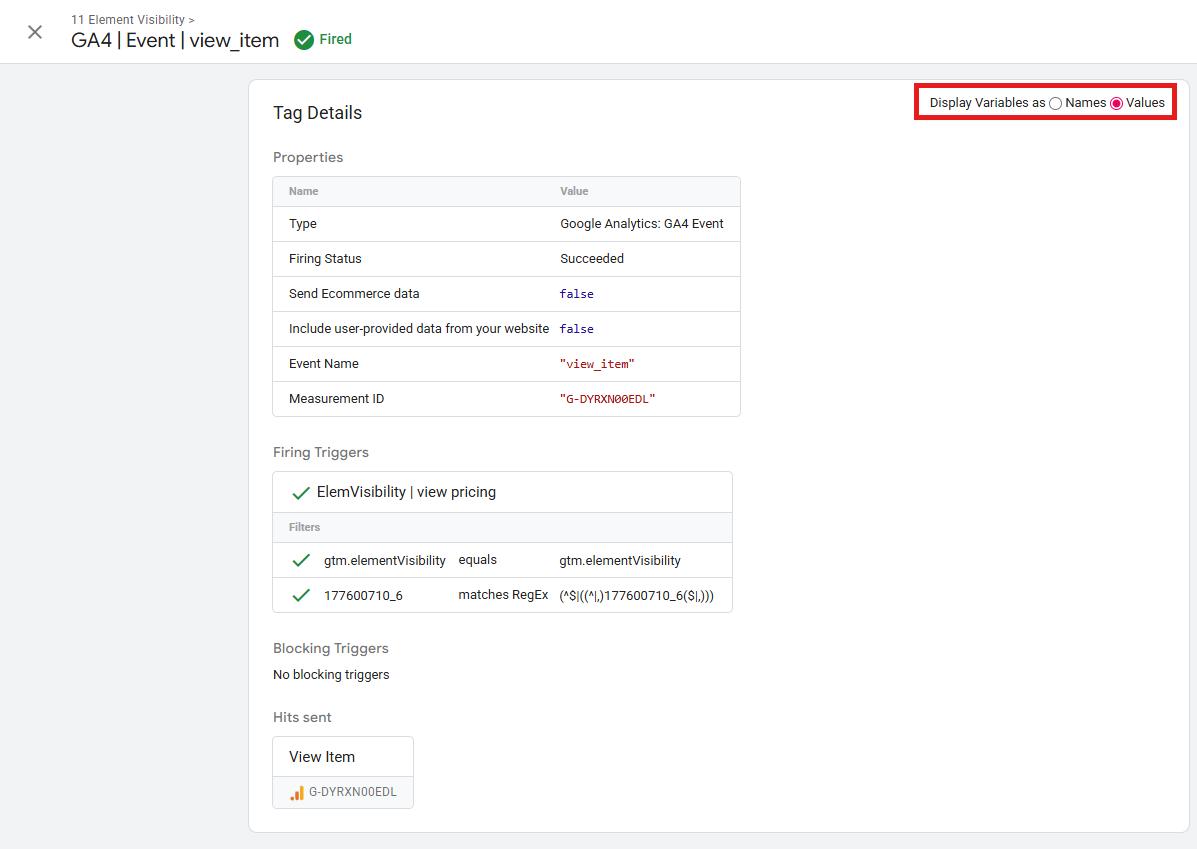
Inside each tag, you can switch between “Names” and “Values” view in the top right (“Values” mode shows you exactly what data each tag sent).
-
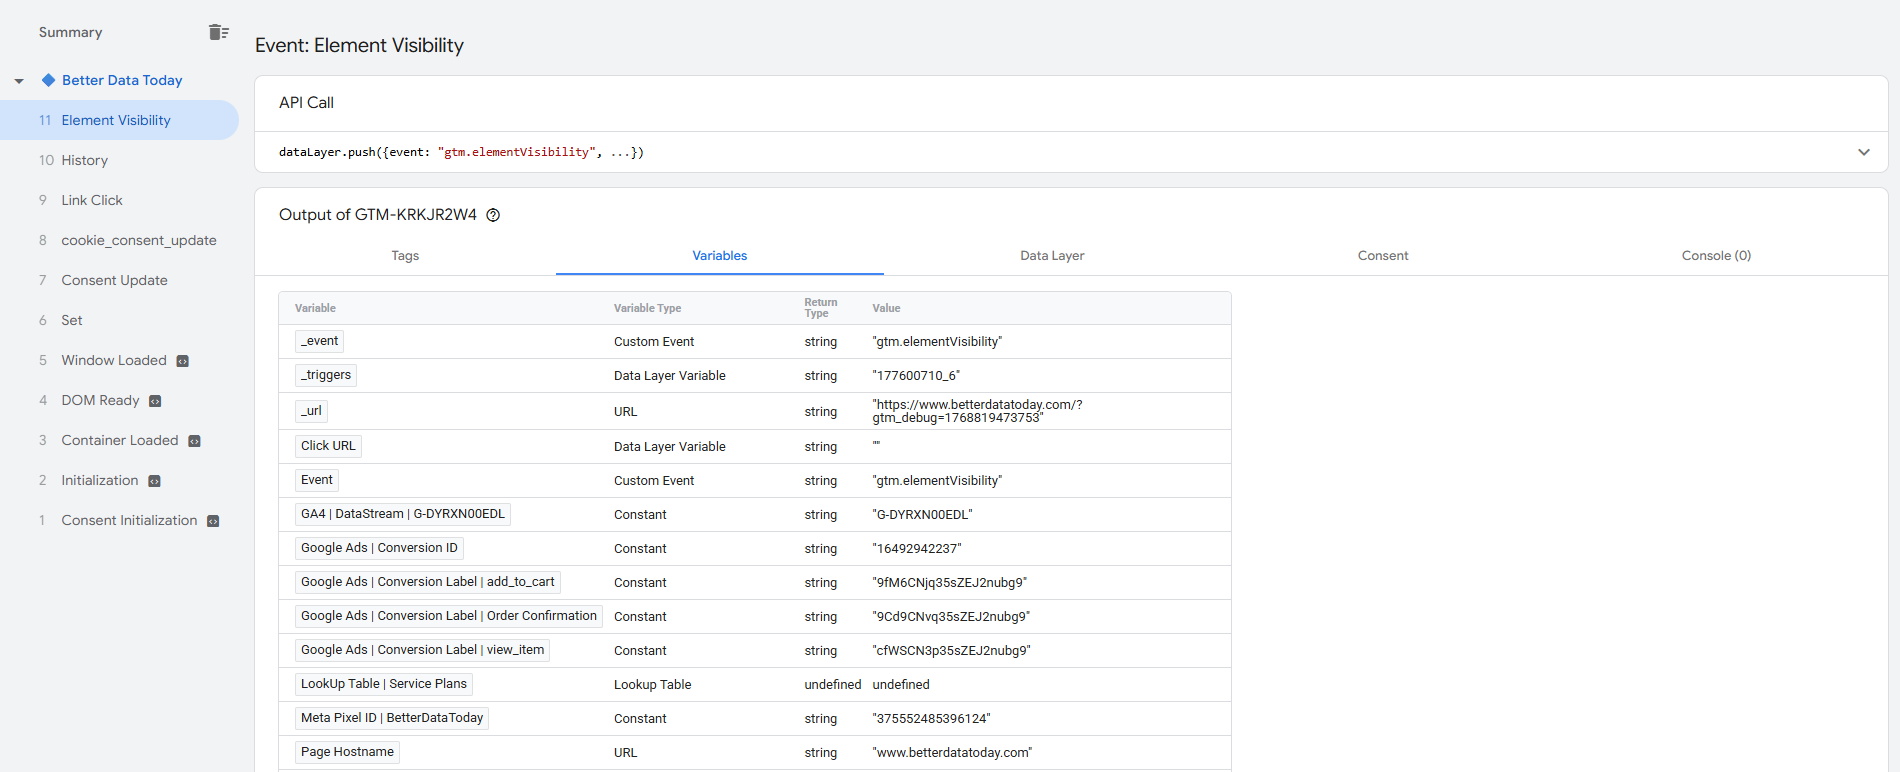
Variables tab lists every variable available at the moment of the selected event, complete with its value. Start here if you’re troubleshooting why a tag sent the wrong data.
-
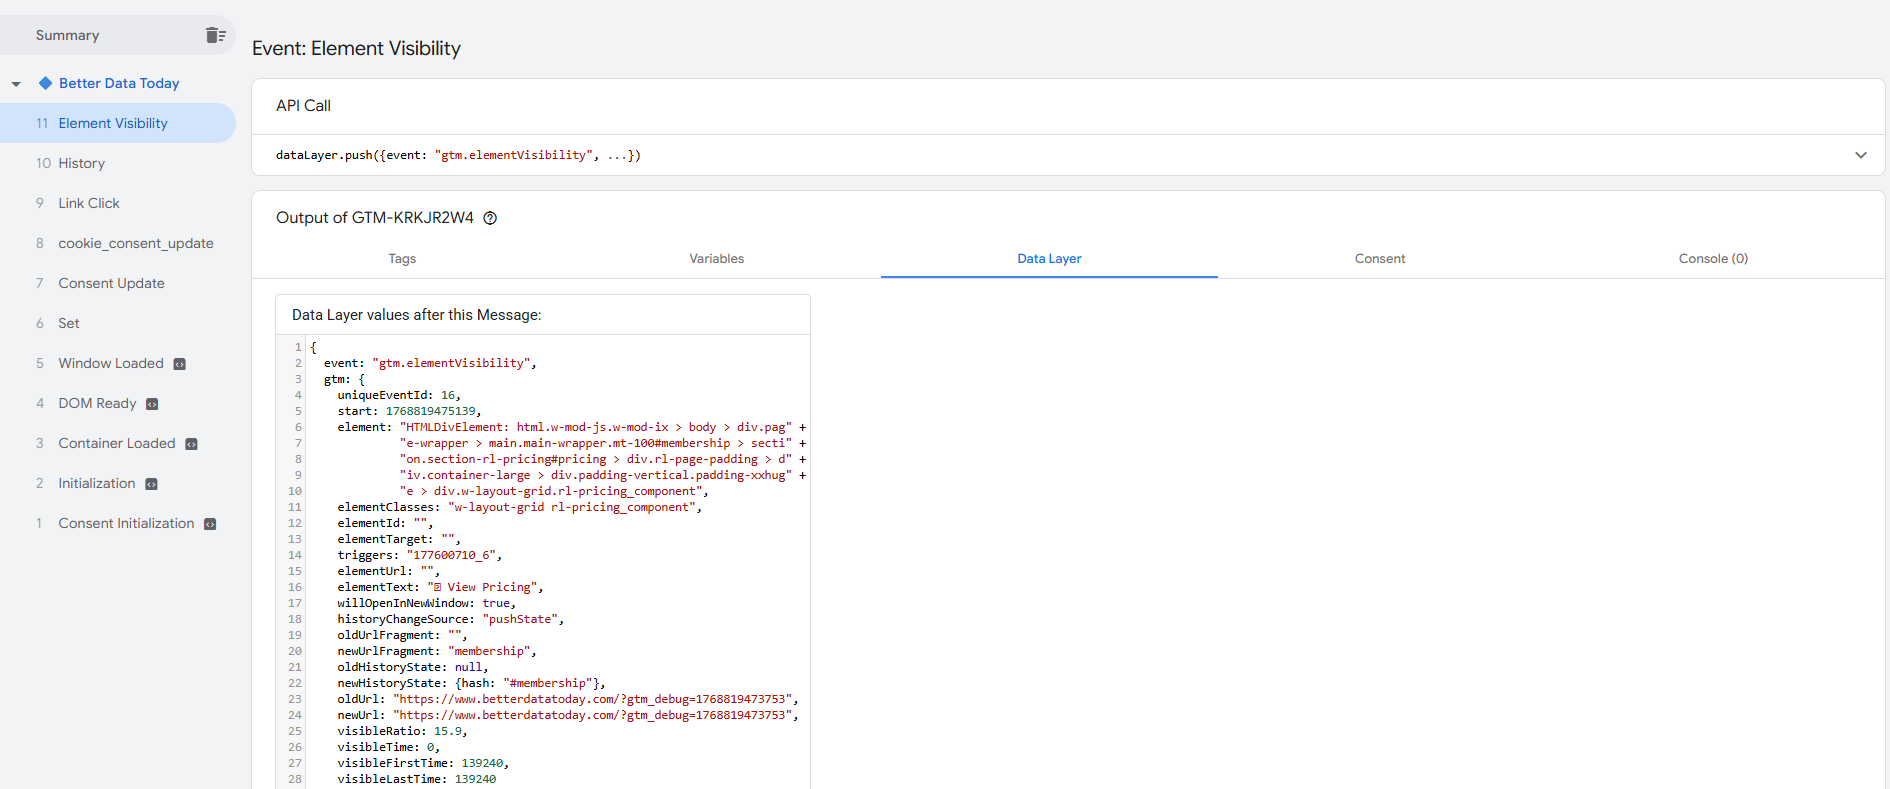
Data Layer tab displays the raw data layer contents. This is where developers push information from your website into GTM.
-
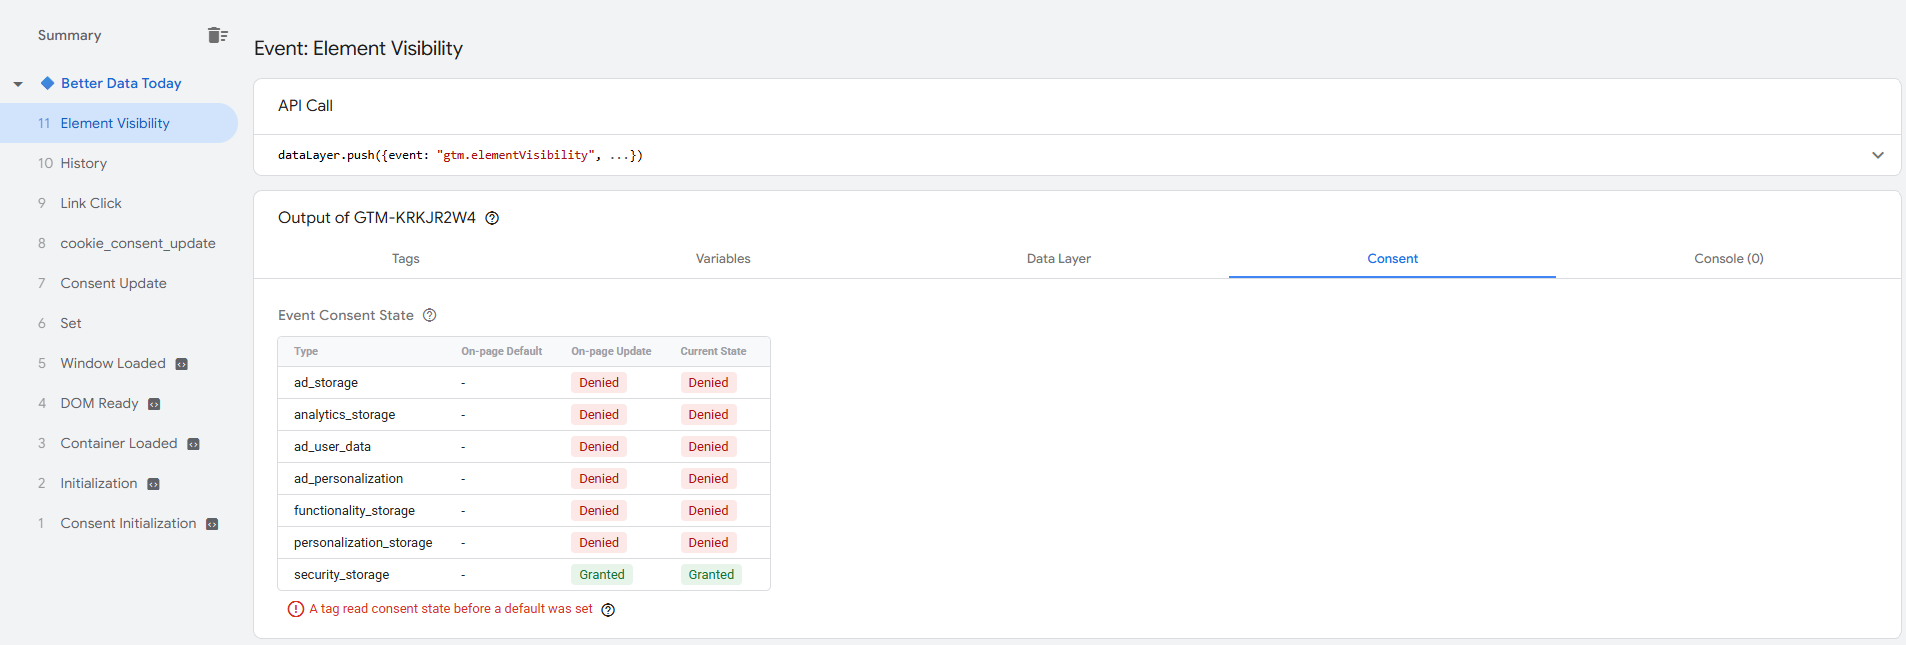
Consent tab shows consent status if you’ve implemented Google Consent Mode. You’ll see whether each consent type (analytics, advertising, etc.) was granted or denied.
-
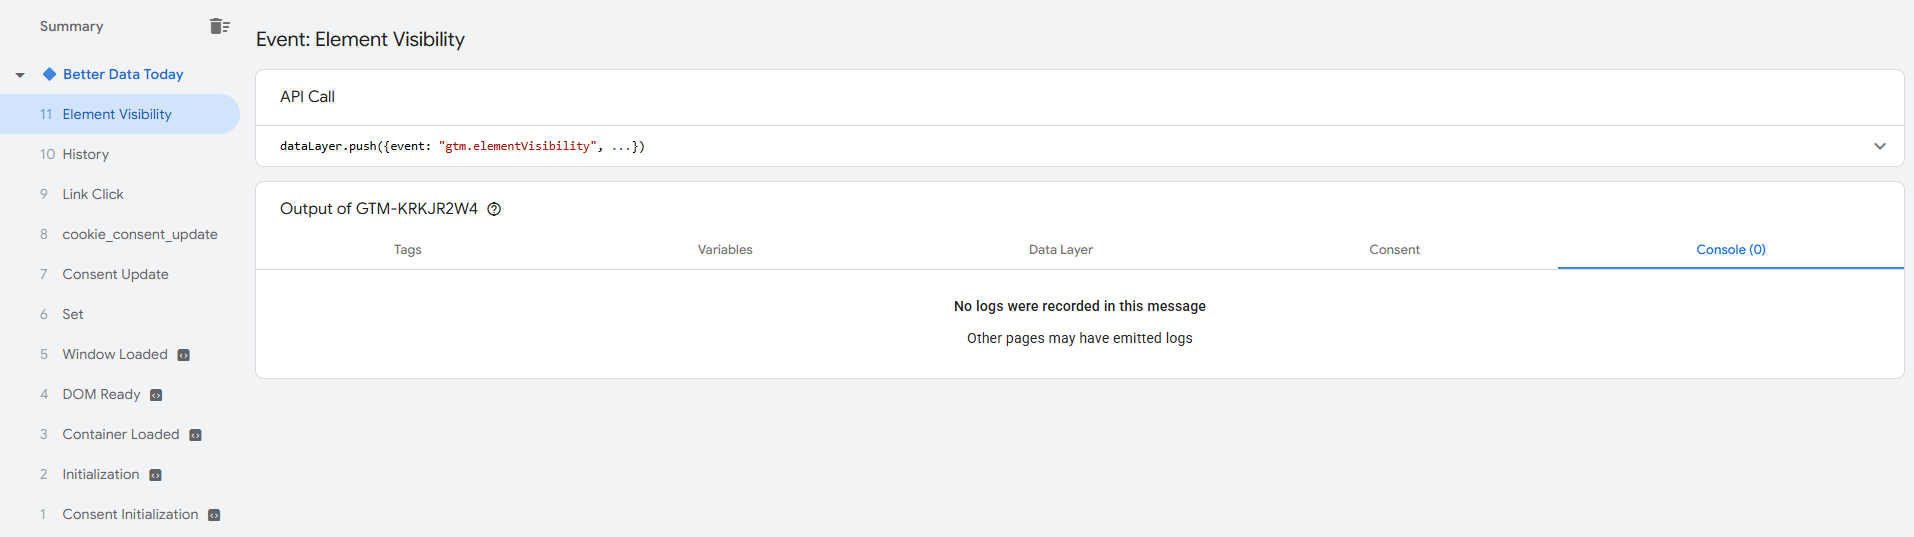
Console tab displays JavaScript errors, tag failures, and console messages. Check this first when tags aren’t executing correctly or when you need to see custom debug messages from your tags.
Using Preview mode to test your tracking setup
To make sure your tracking works correctly, you can follow these simple steps on Preview mode:
-
Test the obvious scenarios
Start by loading a page and checking that your basic pageview tags fire on Container Loaded. Look for your Google Analytics 4 (GA4) configuration tag and any pageview event tags. Then interact with your website like a real visitor would:
- Click buttons and links.
- Submit forms.
- Add products to cart.
- Complete a test purchase.
- Play videos.
- Scroll down pages.
Each action creates events in the timeline. Click each event and verify the expected tags fired.
-
Investigate what didn’t work
When a tag should have fired but didn’t, click it under “Tags Not Fired” to see why. Preview mode shows you exactly which trigger condition failed.
-
Verify your data accuracy
Open the Variables tab for events where tags fired. Check that variables like Click Text, Form ID, or custom data layer variables contain the correct values. If something shows as “undefined”, your variable configuration needs adjustment or the data doesn’t exist in the data layer at that moment.
-
Refresh after making changes
When you edit something in GTM, click Preview again to reload your debugging session. And if you need to share your Preview session with someone, click the three dots in the Preview header, select Share, and copy the URL. Anyone with that link can see your debugging session.
Pro tip: if you run multiple GTM containers, use the dropdown in the Preview header to switch between them. You can test each container without leaving Preview mode.
Preview mode best practices
Here’s a quick checklist you can keep close at all times:
- Always test before publishing. No exceptions.
- Don’t debug from the Summary view. Select specific events in the timeline first.
- Switch to “Values” view when checking tag configurations (it’s much clearer than “Names” view).
- Refresh Preview mode after every GTM edit (otherwise your changes won’t appear).
- Walk through complete scenarios to test the user journey (not just individual pages).
- Use the Data Layer tab to discover available data you didn’t know existed.
- Check the Console tab even when everything seems to work (just in case).
Common issues to watch out for
When debugging in Preview mode, you’ll encounter a few of problems repeatedly. This table helps you diagnose and fix some of them quickly.
| Issue | Why it’s happening | How to fix it |
|---|---|---|
| Tag shows under “Tags Fired” but there’s no data in GA4 DebugView | Browser extension, consent settings, or ad blocker is blocking the request to GA4 | Open your browser’s Network tab and filter for “google-analytics.com” or “analytics.google.com”. Look for failed requests. Temporarily disable ad blockers and privacy extensions, then retest. |
| Variable shows “undefined” | The data doesn’t exist in the data layer when the event fires, or your data layer variable name has a typo | Click the Data Layer tab for that event. Search for your variable name (keep in mind that data layer keys are case-sensitive). If it’s not there, the data isn’t being pushed or you’re checking too early. |
| Click trigger doesn’t fire at all | GTM’s click listener isn’t active on your page | Create at least one “All Elements” or “Just Links” trigger and publish it. GTM only activates listeners when triggers need them. After publishing, refresh Preview mode. |
| Form submission trigger fires twice | Your form redirects to a “thank you” page and fires on both form submit and the subsequent pageview | Add a trigger exception: “Form URL does not contain “thank you” (or whatever your confirmation page is). Alternatively, use “Check Validation” if you only want successful submissions. |
| Tag fires on every page when it should only fire on one specific page | Your Page View trigger doesn’t have the right URL filter, or you’re using “contains” when you need “equals” | Check your trigger’s conditions. Use Page Path “equals” for exact matches. Remember that Page URL includes the domain while Page Path doesn’t. |
| Custom event doesn’t appear in the timeline | The dataLayer.push is missing the event key, or there’s a JavaScript error preventing the push | Check the Console tab for errors. View your page source and search for the dataLayer.push code. It must include ‘event’: ‘your_event_name’ to appear as a named event. |
| ”Container Loaded” event is missing | Broken data layer syntax is preventing GTM from initializing properly | Check the Console tab for JavaScript errors. Look for syntax errors in your data layer code. Fix the data layer code in your website’s source. |
| ”Message” event appears in the timeline (usually before Container Loaded) | A dataLayer.push happened without an event key (it’s just pushing data, not triggering an event) | This isn’t an error. Click the event and check the Data Layer tab to see what data was pushed. If you need this to trigger tags, add an event key to the dataLayer.push code. |
| Tag fired but sent wrong parameter values | Variables aren’t resolving correctly at the time the tag fires, or you’re referencing the wrong variable | Switch to Values view and expand the tag. Check what each variable actually contains. If it’s undefined or wrong, verify your variable configuration and timing. |
| Preview mode shows “Connected” but no events appear | GTM container isn’t properly installed on the page, or you’re debugging the wrong container ID | Check the header dropdown and make sure you’ve selected your GTM container, not a GA4 or Google Ads tag. View page source and search for your container ID (GTM-XXXXXX). |
| Trigger shows all green checkmarks but tag still didn’t fire | The tag has a blocking trigger (exception) that’s preventing it from firing | Scroll down to “Blocking Triggers” in the tag details. Click any listed blocking trigger to see which condition prevented the tag from firing. Either remove the blocking trigger entirely, or adjust its conditions so it doesn’t block this specific scenario. |
| Data layer variable worked yesterday but shows “undefined” today | Developers changed the data layer structure or removed the variable | Click the Data Layer tab and expand all objects to see the current structure. Compare it to your data layer variable’s path (check this in GTM > Variables > your variable > Data Layer Variable Name). If the path changed, update your variable’s configuration to match the new structure. |
| Link click fires the wrong URL | You’re testing with Click URL but the element is a button, not a link, or JavaScript is changing the destination | Open the Variables tab for that click event. Check Click Element to see the HTML tag type, Click Classes for CSS classes you can target, and Click Text for the visible text. If the element is a button or the destination is set via JavaScript, create a custom JavaScript variable that extracts the correct URL from the element’s attributes or onclick handler. |
| Tag fires in Preview mode but not after publishing | You’re testing an unpublished version, or your website is serving cached GTM code | Click Submit > Publish to make your changes live. Wait 5-10 minutes for GTM to propagate your changes. Clear your browser cache. Test in an incognito window to confirm the live version works. |
| E-commerce event fires but products array is empty | The e-commerce data layer push happens after GTM fires the event, or the data structure doesn’t match GA4’s format | Click the Data Layer tab for your e-commerce event. Look for the items array: if it’s empty or missing, your dataLayer.push with the items array is happening after the event fires. Move the items push to happen before the event, or combine them into a single dataLayer.push. Also, verify each item has at least item_name or item_id (GA4 requires one of these), plus price and quantity for purchase events. |
| Scroll depth trigger fires multiple times on the same page | This is expected behavior. Because scroll triggers fire each time the user reaches the limit | If you only want it once per page, create a custom HTML tag that fires on Page View and sets a flag: “window.scrollFired = false;”. Then add a trigger condition to your scroll trigger: Custom JavaScript variable returns true only if window.scrollFired is false, and set the flag to true after firing. Or just accept multiple fires and filter them in GA4 reports. |
Keep in mind: Preview mode shows you what happens in GTM, but it doesn’t show you whether that data actually reached your analytics platform correctly. For complete verification, if you’re using GA4, open DebugView while Preview mode is active to see exactly what events and parameters GA4 received.
Final thoughts
Testing in Preview mode takes about three minutes (give or take). Fixing broken tracking after you’ve published can take you 10 times longer. So, we can’t stress this enough: always test before you publish. Check that tags fire when they should, verify the data looks right, and only then hit publish. That’s it. Do this every time and you’ll avoid most of the tracking problems that waste everyone’s time.