QR codes connect physical marketing with digital analytics, but they’re invisible in your reports without proper tracking. GA4 treats QR code scans as “direct” traffic by default, which means they look identical to someone typing your URL manually. In other words, your print ads, product packaging, and event materials generate no attribution data, making it impossible to prove Return on Investment (ROI) or optimize what’s working effectively.
The solution? Incorporate Urchin Tracking Module (UTM) parameters into your QR codes from the start. This guide shows you exactly how to set it up, analyze that data in GA4, and avoid common mistakes.
Why does GA4 classify QR codes as direct traffic?
When someone scans a standard QR code that directly links to your website, GA4 records it as “direct” traffic. There’s no referral source, campaign info, or any detail indicating where users came from, so to GA4, it looks exactly like someone typing your URL into their browser.
That’s where UTM parameters come in. These special tags added to your URL tell GA4 exactly how the visitor arrived. So, when you add UTM parameters to the link inside your QR code, GA4 can then distinguish your QR code scanners from casual direct traffic.
What you need before you start
Before you begin tracking QR codes, make sure you have:
- An active GA4 property: your destination website needs GA4 properly installed and collecting data (if you haven’t sorted this out yet, go through our GA4 setup checklist in this article).
- A destination URL: know exactly which page you want people to land on after scanning the QR code.
- Basic UTM understanding: familiarity with campaign tracking parameters is helpful (learn more about it in this article).
- A QR code generator: access to a tool that creates QR code images (free options are easily accessible online).
6 steps for setting up and tracking QR codes
Now, let’s focus on what truly matters. Follow these easy steps to set up and monitor your QR codes:
1) Choose your destination page
It could be a special offer page, a product details page, an event registration form, or any other relevant destination for your campaign. Write down the URL, because you will need it for the next step.
2) Add UTM parameters to your URL
This is the most important step. To effectively inform GA4 how users reached your page, you need at least three parameters:
-
utm_source
This shows where people view your QR code. Depending on your reporting needs, you can keep it simple by using your company or QR code generator name, or be more specific to help you compare performance across different placements. Examples of the more descriptive approach include: store_display (for in-store placement); product_packaging (on your product boxes); billboard_main_street (outdoor advertising); event_booth (trade show materials); magazine_name (print publication).
-
utm_medium
This describes the marketing channel. QR codes connect offline and online environments, so common values include: qr_code or qr (most straightforward); direct_mail (for QR codes on postcards, flyers, or catalogs); print (if focusing on the printed medium); offline (if grouping all offline efforts).
-
utm_campaign
This groups related QR codes under one campaign name. Use a descriptive name like: spring_sale_2026; product_launch_q2; store_opening_event.
So, your complete URL should look something like this: https://yourwebsite.com/spring-sale?utm_source=store_display&utm_medium=qr_code&utm_campaign=spring_sale_2026.
Tip: use Google’s Campaign URL Builder (available here) to prevent manual errors. It’s free and ensures your parameters are correctly formatted.
3) Shorten your URL
Here’s something many marketers often forget: longer URLs produce more complex QR codes. Those black-and-white squares become smaller and denser, making them harder to scan from a distance or with an older phone camera.
URL shorteners solve this problem (you can easily find free options online). They compress your long URL into a shorter one that still includes all your tracking information.
4) Generate and test your QR code
Now you’re ready to generate the actual QR code:
- Use any free QR code generator available online and paste your shortened URL.
- Save the generated image (for print materials, make sure it’s high-resolution).
- Test your QR code before sharing or printing it. Here’s how:
-
Scan the QR code with your smartphone.
-
Confirm it loads the correct landing page.
-
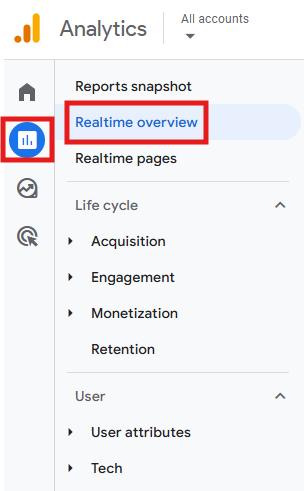
Open GA4 and navigate to Reports > Realtime overview.
-
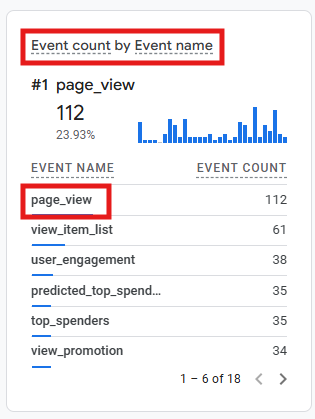
Look for the Event count by Event name card and click on the page_view event.
-
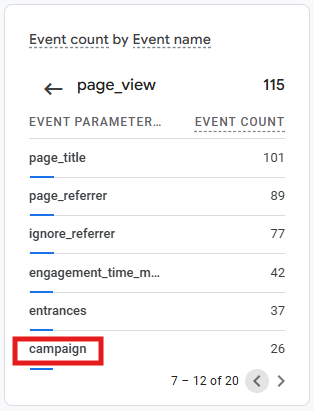
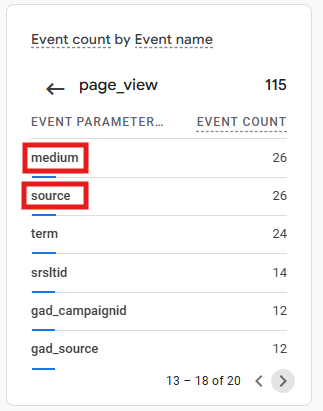
Check that your UTM parameters appear exactly as you set them. You should see: campaign (with your utm_campaign value); medium (with your utm_medium value); source (with your utm_source value).
-
If you don’t see your parameters, or if they appear differently than expected, your URL wasn’t properly formatted. Double-check it and regenerate the QR code.
-
5) Create a custom channel group (before launching your campaign)
If QR codes are a significant part of your marketing strategy, creating a custom channel group in GA4 will gather all your offline QR traffic in one place and improve reporting speed.
Here’s why this is important: the UTM values we’re using (like utm_medium=qr_code or utm_medium=offline) don’t match any of GA4’s default channel definitions, which means your QR code traffic will automatically show up as “Unassigned” in reports unless you create a custom channel group first. Setting this up ahead of time ensures your data stays organized from the start:
-
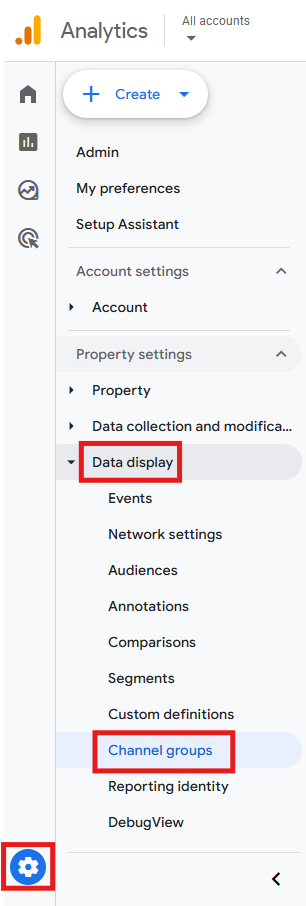
Navigate to Admin > Data display > Channel groups.
-
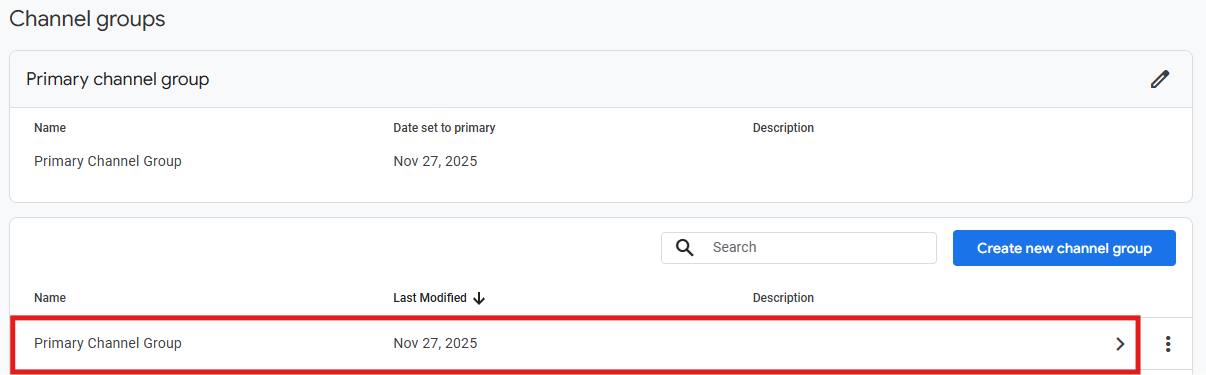
Click your Default Channel Group to edit it.
-
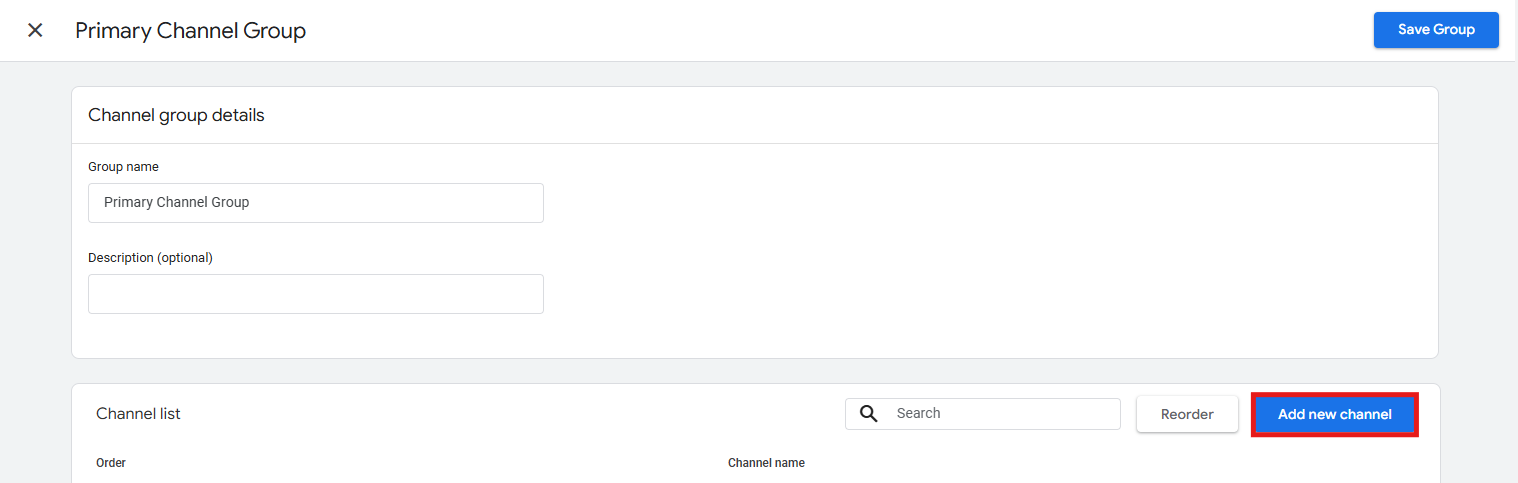
Under Channel list, click Add new channel.
-
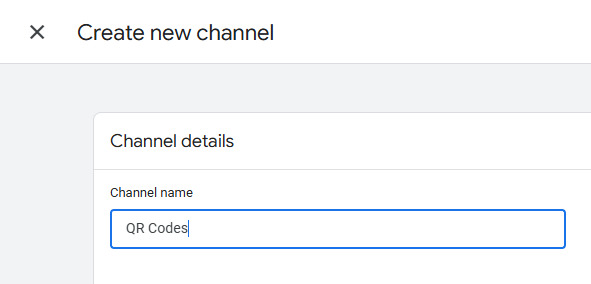
Name it something like QR Codes.
-
Set the following condition: Medium matches exactly qr_code (or whatever medium value you use). In the end, click Save channel.
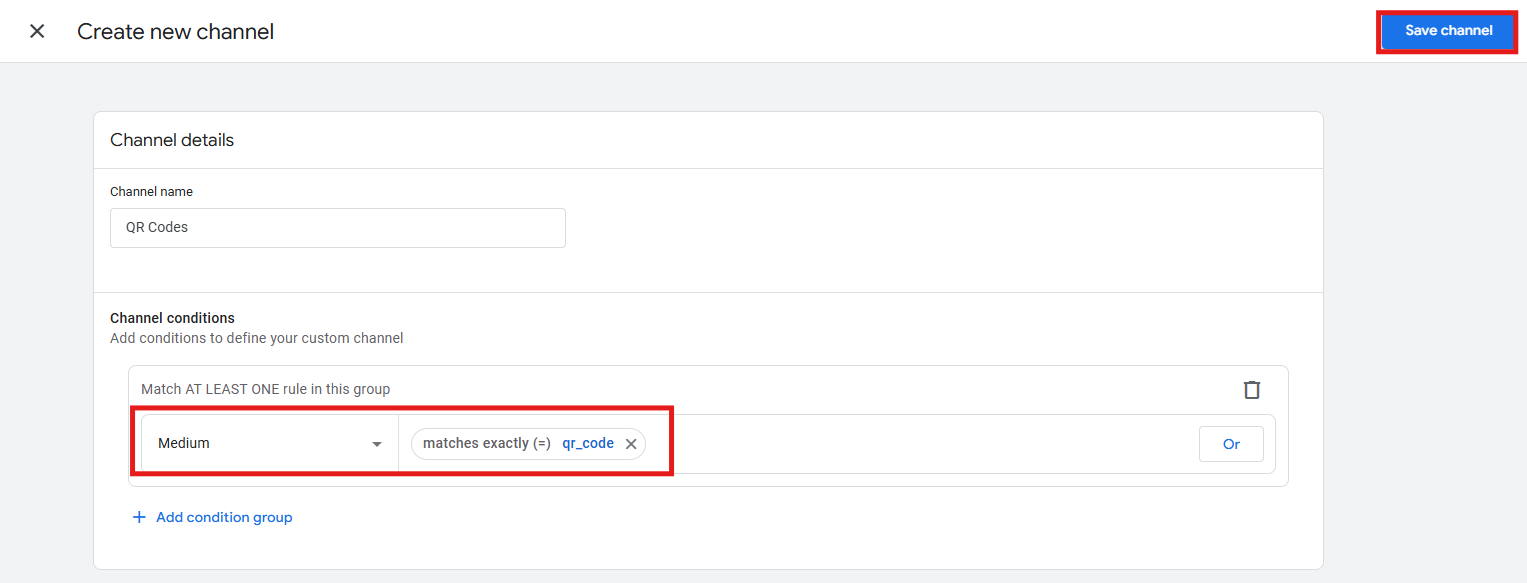
Now your QR traffic shows up as a separate channel alongside organic, paid, social, and email in all your standard reports.
6) Monitor QR code data in GA4
After your campaign launches, wait 24 to 48 hours for GA4 to process the data. Then, to view your QR code traffic:
-
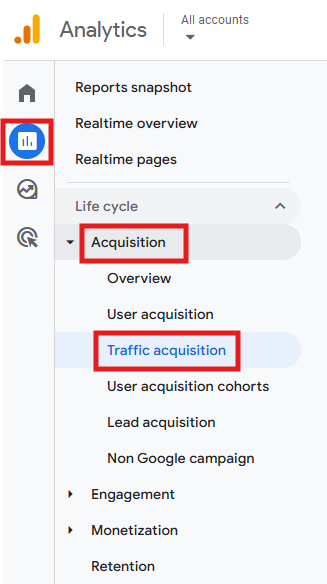
Navigate to Reports > Acquisition > Traffic Acquisition.
-
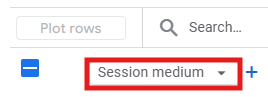
Below the main graphic, switch the primary dimension (which, by default, is Session default channel grouping) to Session medium to see your QR code medium value in the list.
Note: you don’t need to do this if you created a custom channel group in step 5, because your QR traffic will also appear in the default channel grouping view under your custom channel name.
-
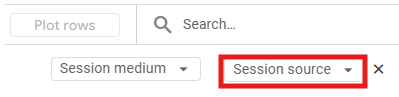
Click the + icon to add a secondary dimension, in this case, Session source. This lets you compare performance across different QR code placements, revealing which one drives more traffic, which converts better, etc.
-
Analyze the report to see metrics like: Sessions (total scans); Engaged sessions (quality traffic); Engagement rate (how compelling your landing page is); Key events (conversions); Total revenue (if you have e-commerce tracking enabled).

3 UTM naming approaches for QR codes
The approach you choose should align with your reports and business goals. See which one of these suits you better:
Approach #1: Focus on the QR code itself
This straightforward approach works well for most businesses:
- utm_source = your company name or QR generator name.
- utm_medium = qr_code or qr.
- utm_campaign = campaign name (e.g., spring_sale_2026).
Approach #2: Focus on the physical placement
This approach provides more context about offline marketing performance and is often recommended when you’re managing multiple offline campaigns and want to compare channels like print, outdoor, and in-store against each other:
- utm_source = where the QR code appears (magazine name, store location, event name).
- utm_medium = print, offline, or event.
- utm_campaign = campaign name.
Approach #3: A combination of the previous two
You can also use a hybrid approach to get the best of both worlds by adding extra UTM parameters like utm_content. Here’s an example of how to do this:
- utm_source = store_display
- utm_medium = qr_code
- utm_campaign = spring_sale_2026
- utm_content = poster_entrance
Keep in mind: the more parameters you add, the longer your URL will become. Consistent naming conventions and URL shorteners are even more crucial in these situations.
8 mistakes to avoid in QR code tracking
Do you want to avoid some of the most common mistakes people make in this process? Learning about them beforehand is essential:
-
Using inconsistent naming conventions
If you use qr_code on one campaign, qr-code on another, and QR Code on a third, you’ll end up with three separate sources in your reports. Pick a format (we recommend lowercase with underscores) and use it consistently across all campaigns.
-
Skipping the test phase
Testing will take you no more than two minutes. In contrast, reprinting thousands of flyers because your QR code isn’t working can take days and cost a fortune.
-
Forgetting about mobile optimization
Anyone scanning a QR code is using a mobile device. So, if your landing page isn’t mobile-friendly, you’re wasting your tracking efforts. Make sure your destination page loads quickly and looks good on small screens.
-
Not creating a custom channel group
If you skip the custom channel group setup (step 5), your QR code traffic will appear as “Unassigned” in GA4 reports. While technically functional, this makes analysis disorganized and more time-consuming.
-
Including personal data in URLs
Never include Personally Identifiable Information (PII) – like names, addresses, or contacts – in URL parameters. This violates GA4’s terms of service and can lead to your property being suspended.
-
Deciding to track QR codes that are already printed
If your QR codes are already in use without UTM parameters, you can’t add tracking retroactively. The only option is to generate new codes with tagged URLs and, of course, plan ahead for your next campaign.
-
Tracking QR codes that link to non-web destinations
GA4 can only track QR codes that lead to web pages with your GA4 tracking code installed. If your QR code links directly to a PDF download, a YouTube video, or a third-party website, you will not see the data in your GA4 property. For PDFs, create a landing page with a download link instead. For videos, embed them on your own website instead of linking directly to YouTube.
-
Not accounting for data processing delays
While real-time reports display data immediately, it can take 24 to 48 hours for your QR code traffic to fully process and appear in standard GA4 reports. If you don’t see your campaign data right away in Traffic Acquisition, be patient.
Final thoughts
QR code tracking with GA4 is simple once you understand the steps, but it requires some preparation. The key is to integrate your tracking into the QR code from the start, instead of adding it later. Remember the workflow:
- Choose your landing page.
- Add UTM parameters.
- Shorten the URL.
- Generate and test the QR code.
- Create a custom channel group.
- Monitor results in Traffic Acquisition reports.
With this setup, your offline marketing performance will be visible in your analytics, allowing you to prove ROI, optimize placements, and make smarter decisions about where to allocate your print and outdoor marketing budget.